Welcome to the Advanced Dashboard Guide!
Here you will find everything you need to set up and use an Advanced Dashboard.
Adding Blocks to the Dashboard
The Advanced Reports extension provides you with the ability to create custom dashboards to display almost any metrics from your store.
Create multiple dashboards with different widgets to quickly analyze your store activity like sales, customer activities, marketing efficiency, etc.
Create as many boards as you want and add as many widgets as you'd like to each board.
Dashboards can be private (only the user that created the board will be able to see it) or public (all admin users will be able to access them). You can also enable the quick access to dashboards so you can access them without logging into the admin panel of your store.
Interface
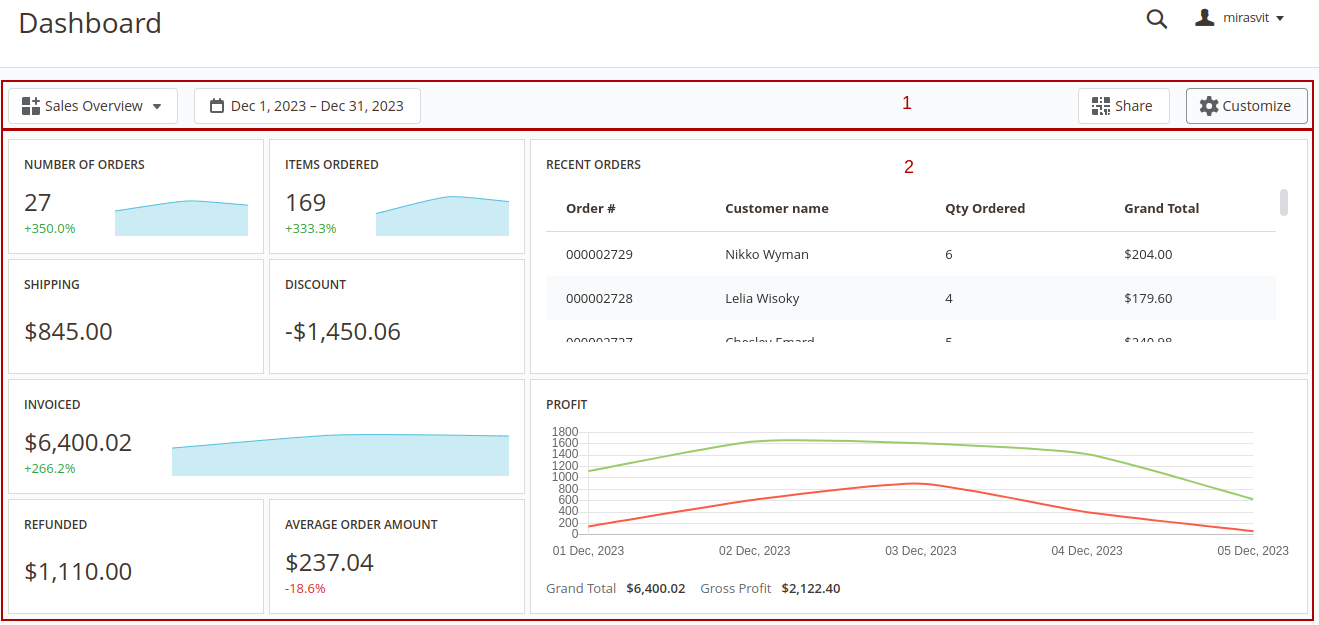
The interface of each dashboard contains 2 main sections: 1 Toolbar - the section where all control elements are placed. In the view mode the extension has the following control elements:
- Menu - navigation between boards
- Date Filter - select the date range that will be used for filtering data in the dashboard.
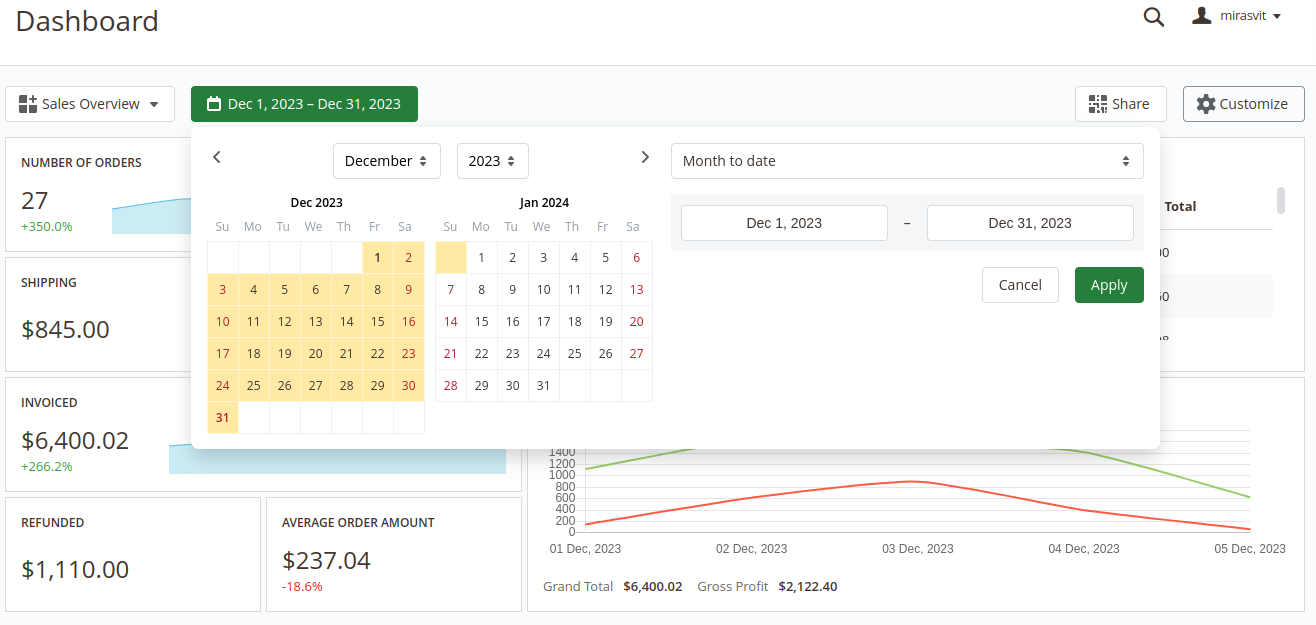 Widgets can have their own date ranges.
In this case, the Date Filter will not affect such widgets. More information about custom date ranges for widgets can be found here
Widgets can have their own date ranges.
In this case, the Date Filter will not affect such widgets. More information about custom date ranges for widgets can be found here - Share - enable/disable quick access to the current board
- Customize - switch board mode between View and Configure modes 2 Dashboard - the board where all widgets are displayed
Configuring Boards
To edit the current board or create a new one press the Customize button in the toolbar. The board will be switched to the Configure mode.
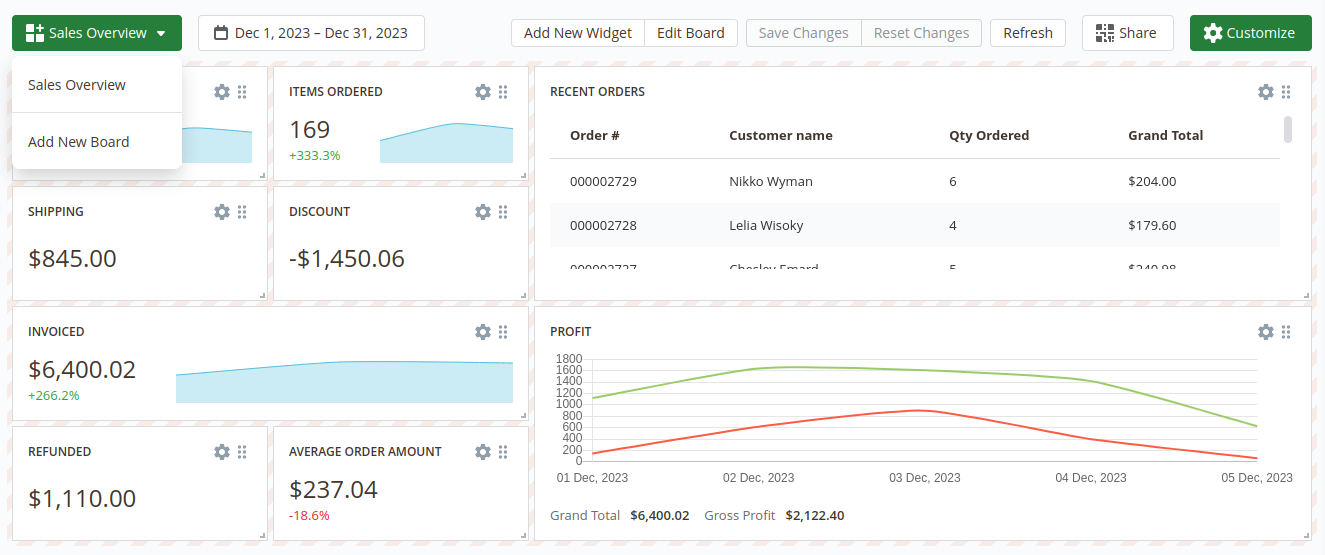
After switching the board to the Configure mode the additional control elements in the Toolbar will appear:
- Add New Widget - add widget to the current board
- Edit Board - change the general settings of the board
- Save Changes - save the dashboard after configuring it
- Reset Changes - reset the board to the previously saved version
- Refresh - refresh the data in the board
Also in the Configure mode each widget can be adjusted. More information about adjusting widgets is described in the Widgets Settings section
To create a new board open the Menu in the toolbar and click on the Add New Board option. After that, the popup will appear when you can set the main board information:
- Title - the name of the current board
- Type - defines the access scope for the current board - Private or Public
- Is Default - defines whether the current board should be displayed by default or not
These settings can be changed later by clicking the Edit Board button in the Toolbar.
After creating the board you can proceed with adding widgets to that board.
Configuring Widgets
To add a widget into the board press the Add New Widget button.
The extension will show a pop-up where you'll be able to choose one of the widgets from the extension's widgets library or create an empty widget and configure it from scratch.
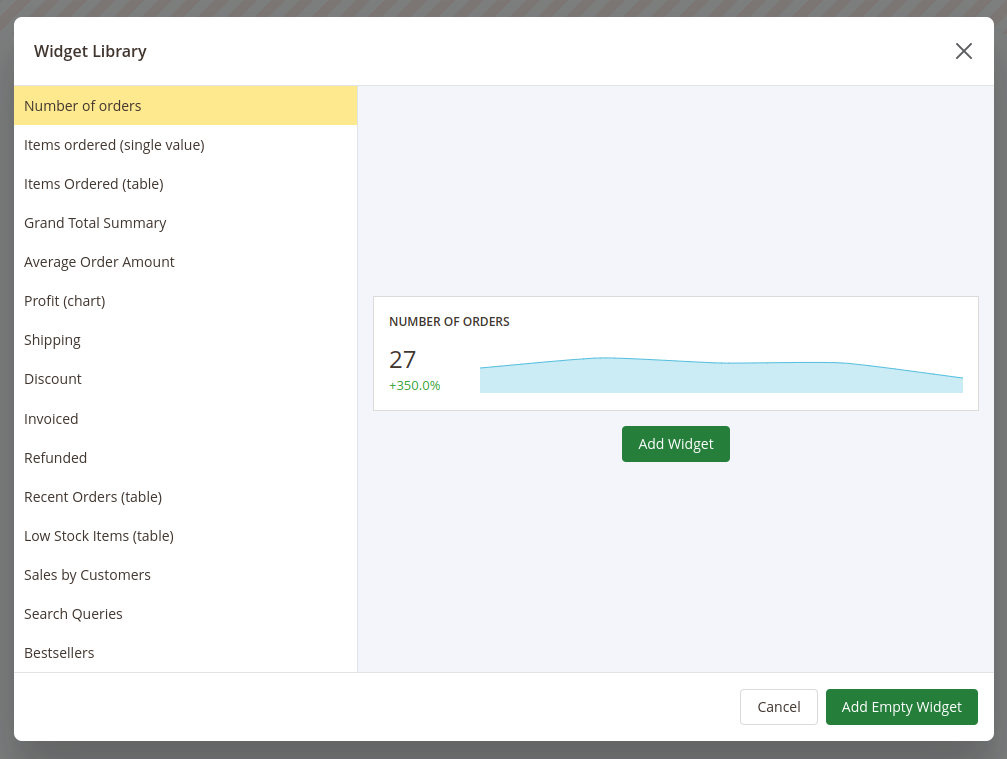
After adding a new widget you can adjust it even if the widget is added from the widgets library.
To change the place where the widget should be placed press on the icon in the right top corner of the widget, drag the widget and drop it in the place instead of the board field where you'd like for this widget to be placed in.
To adjust the size of the widget press on the bottom right corner of the widget and drag the cursor to change the size of the widget.
To configure the widget press the gear icon in the right top corner of the widget. The Widget Editor will appear.
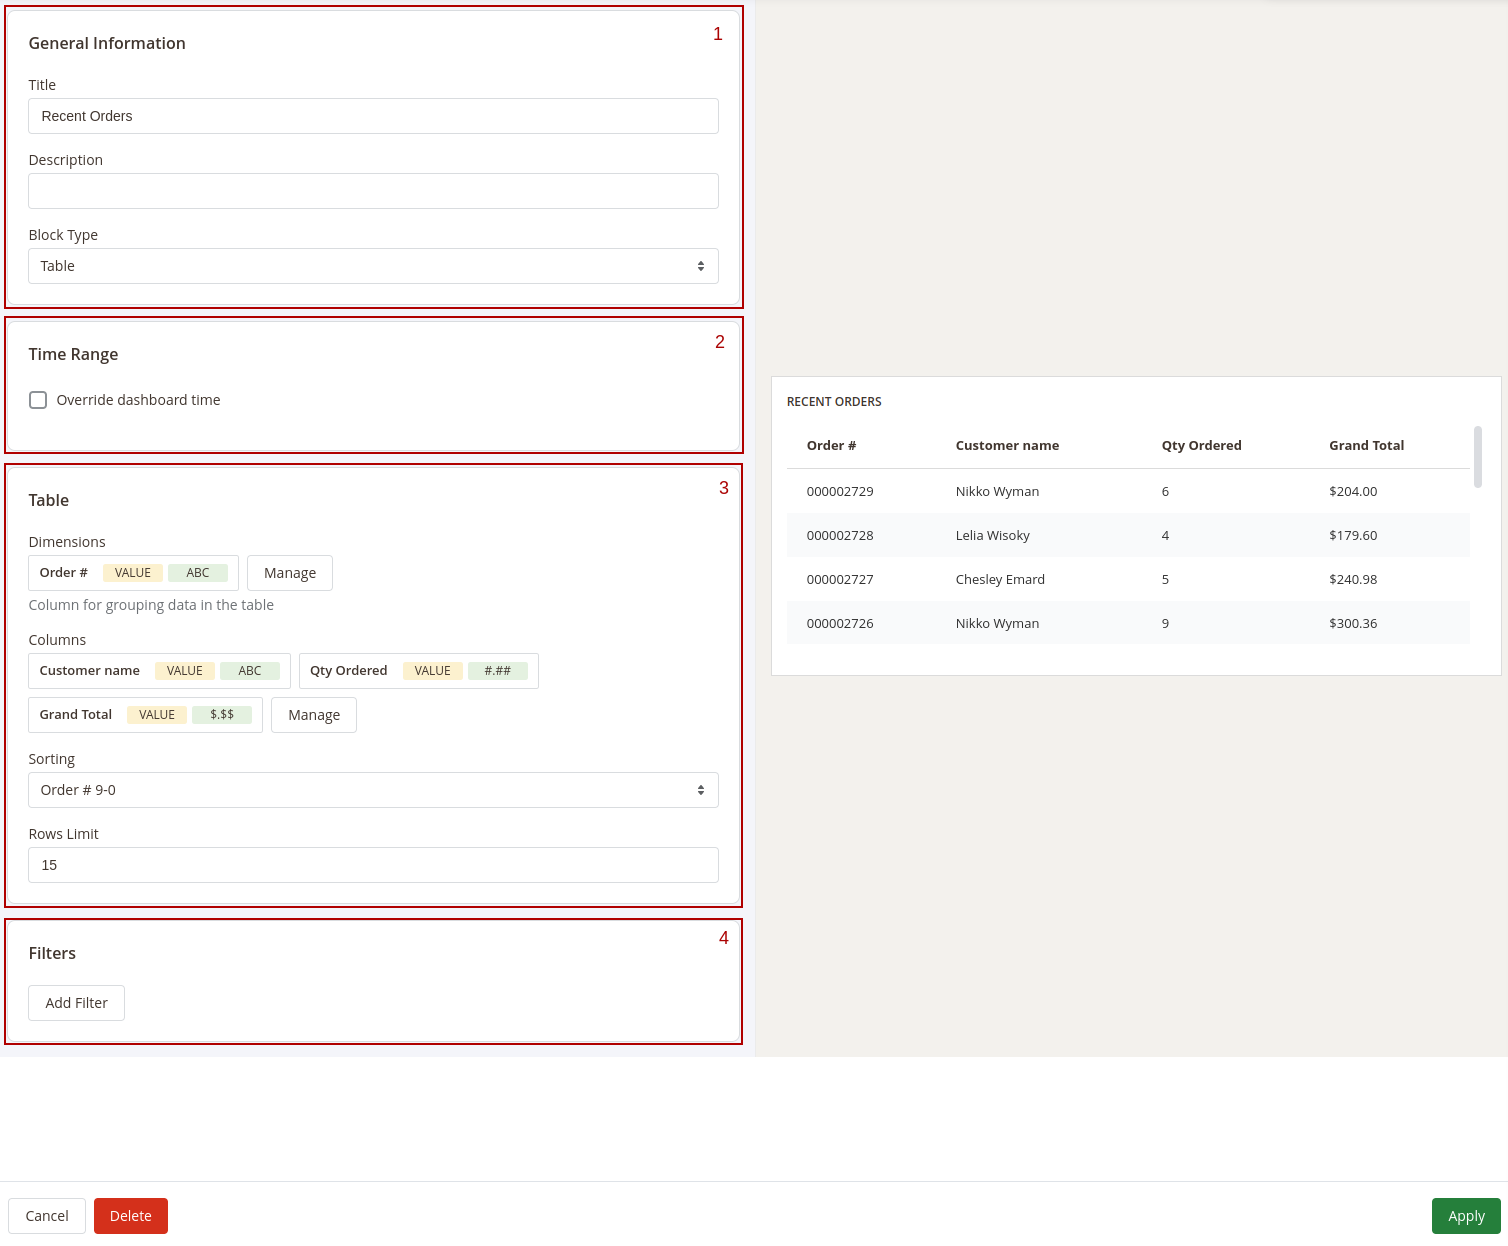
The Widget Editor has 2 sections - Widget Settings to configure the widget and Preview to check how the data in the widget will be displayed before saving the widget.
the Widget Settings section has the following inner sections:
- General - main configurations of the widget. This section has the following settings:
- Title - the name of the widget
- Description - widget's description
- Type - defines how the data in the widget should be displayed.
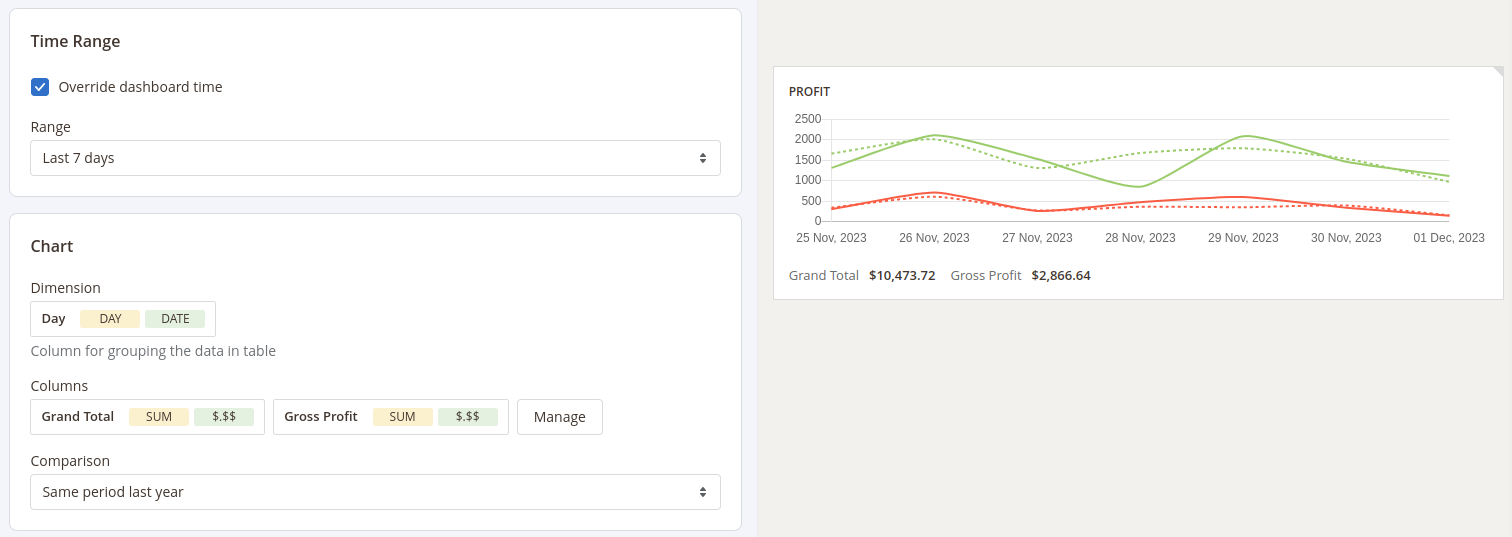
- Time Range - date filter settings for the widget. This section has only one setting - Override dashboard time. When this setting is enabled the widget will use its own date range to filter the data. You'll be able to choose one of predefined date ranges from the Range dropdown.
- Widget's content settings this section depends on the Type of the widget and has different setting options correspondingly:
- Single Value - shows the single value in the widget
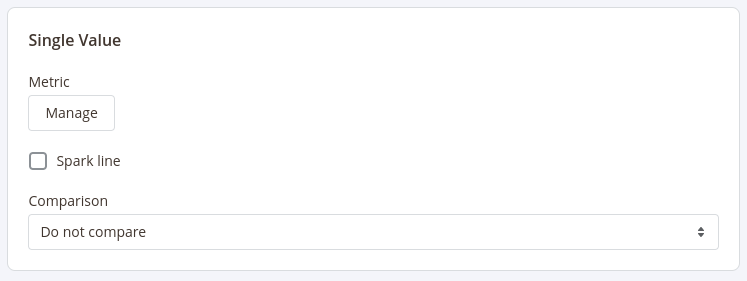 This type has 3 settings:
- Metric - choose the column for which the data in the widget should be displayed
- Spark Line - show/hide the sparkline representing changes of the value from the column selected in the Metric setting during the time range applicable for current widget
- Comparison - choose the period for which the widget should display the value for the same metric to compare it with the current value
- Table - displays the table with values according to the configurations (similar to how the reports are displayed)
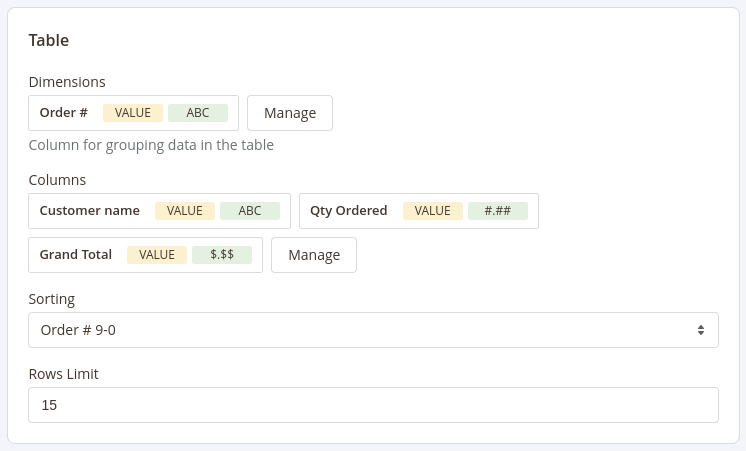 This type has 4 settings similar to settings in reports configurations:
- Dimensions - set the dimensions for the table
- Columns - select fields that should be displayed in the report
- Sorting - select the column for the report to be sorted by and the sorting direction. Options depend on the fields selected in the Dimensions and Columns settings
- Rows Limit - set the limit for the number of rows to be displayed in the table
- Chart - displays the data in the widget as a chart
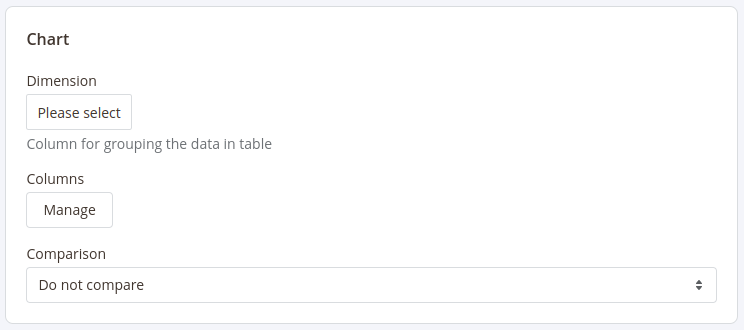 This type has 3 settings:
- Dimension - defines the horizontal axe in the chart
- Columns - defines the fields data that should be used in the chart
- Comparison - defines the period in which the current data in the chart should be compared
- Single Value - shows the single value in the widget
- Filters - configure fields and conditions by which the data in the widget should be filtered. Similar to the Filters settings in reports configurations
After configuring the widget press the Apply button to apply the widget settings' changes.
After adding and configuring all widgets to the board press the Save Board button in the Toolbar and click the Customize button to exit the Configure mode.
Sharing Boards
Get quick access to the board without necessity to log into the admin panel by enabling sharing the dashboard.
To enable sharing dashboard click the Share button in the toolbar. The pop-up will appear where you can enable sharing the dashboard.
After sharing for the dashboard is enabled the pop-up will show the quick access link and QR code by which you can access the current dashboard on any device.
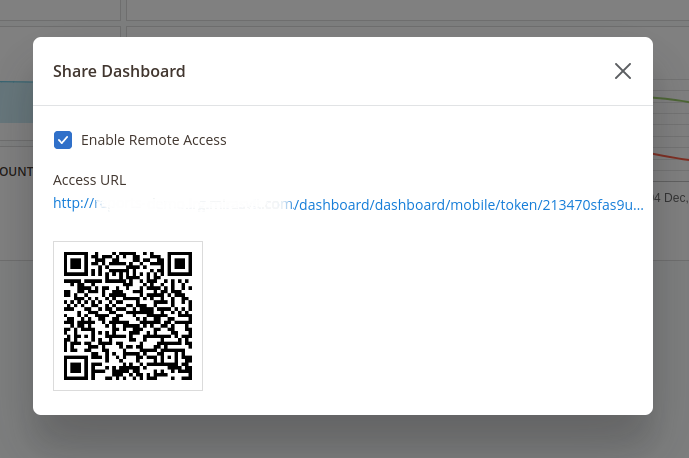
Share the link to the dashboard or QR code with your colleagues so they'll be able to access the dashboard and see all the metrics in it at any time.
Adding Blocks to the Dashboard
The Advanced Reports extension provides you with the ability to create custom dashboards to display almost any metrics from your store.
Create multiple dashboards with different widgets to quickly analyze your store activity like sales, customer activities, marketing efficiency, etc.
Create as many boards as you want and add as many widgets as you'd like to each board.
Dashboards can be private (only the user that created the board will be able to see it) or public (all admin users will be able to access them). You can also enable the quick access to dashboards so you can access them without logging into the admin panel of your store.
Interface
The interface of each dashboard contains 2 main sections: 1 Toolbar - the section where all control elements are placed. In the view mode the extension has the following control elements:
- Menu - navigation between boards
- Date Filter - select the date range that will be used for filtering data in the dashboard.
Widgets can have their own date ranges.
In this case, the Date Filter will not affect such widgets. More information about custom date ranges for widgets can be found here
- Share - enable/disable quick access to the current board
- Customize - switch board mode between View and Configure modes 2 Dashboard - the board where all widgets are displayed
Configuring Boards
To edit the current board or create a new one press the Customize button in the toolbar. The board will be switched to the Configure mode.
After switching the board to the Configure mode the additional control elements in the Toolbar will appear:
- Add New Widget - add widget to the current board
- Edit Board - change the general settings of the board
- Save Changes - save the dashboard after configuring it
- Reset Changes - reset the board to the previously saved version
- Refresh - refresh the data in the board
Also in the Configure mode each widget can be adjusted. More information about adjusting widgets is described in the Widgets Settings section
To create a new board open the Menu in the toolbar and click on the Add New Board option. After that, the popup will appear when you can set the main board information:
- Title - the name of the current board
- Type - defines the access scope for the current board - Private or Public
- Is Default - defines whether the current board should be displayed by default or not
These settings can be changed later by clicking the Edit Board button in the Toolbar.
After creating the board you can proceed with adding widgets to that board.
Configuring Widgets
To add a widget into the board press the Add New Widget button.
The extension will show a pop-up where you'll be able to choose one of the widgets from the extension's widgets library or create an empty widget and configure it from scratch.
After adding a new widget you can adjust it even if the widget is added from the widgets library.
To change the place where the widget should be placed press on the icon in the right top corner of the widget, drag the widget and drop it in the place instead of the board field where you'd like for this widget to be placed in.
To adjust the size of the widget press on the bottom right corner of the widget and drag the cursor to change the size of the widget.
To configure the widget press the gear icon in the right top corner of the widget. The Widget Editor will appear.
The Widget Editor has 2 sections - Widget Settings to configure the widget and Preview to check how the data in the widget will be displayed before saving the widget.
the Widget Settings section has the following inner sections:
- General - main configurations of the widget. This section has the following settings:
- Title - the name of the widget
- Description - widget's description
- Type - defines how the data in the widget should be displayed.
- Time Range - date filter settings for the widget. This section has only one setting - Override dashboard time. When this setting is enabled the widget will use its own date range to filter the data. You'll be able to choose one of predefined date ranges from the Range dropdown.
- Widget's content settings this section depends on the Type of the widget and has different setting options correspondingly:
- Single Value - shows the single value in the widget
This type has 3 settings:
- Metric - choose the column for which the data in the widget should be displayed
- Spark Line - show/hide the sparkline representing changes of the value from the column selected in the Metric setting during the time range applicable for current widget
- Comparison - choose the period for which the widget should display the value for the same metric to compare it with the current value
- Table - displays the table with values according to the configurations (similar to how the reports are displayed)
This type has 4 settings similar to settings in reports configurations:
- Dimensions - set the dimensions for the table
- Columns - select fields that should be displayed in the report
- Sorting - select the column for the report to be sorted by and the sorting direction. Options depend on the fields selected in the Dimensions and Columns settings
- Rows Limit - set the limit for the number of rows to be displayed in the table
- Chart - displays the data in the widget as a chart
This type has 3 settings:
- Dimension - defines the horizontal axe in the chart
- Columns - defines the fields data that should be used in the chart
- Comparison - defines the period in which the current data in the chart should be compared
- Single Value - shows the single value in the widget
- Filters - configure fields and conditions by which the data in the widget should be filtered. Similar to the Filters settings in reports configurations
After configuring the widget press the Apply button to apply the widget settings' changes.
After adding and configuring all widgets to the board press the Save Board button in the Toolbar and click the Customize button to exit the Configure mode.
Sharing Boards
Get quick access to the board without necessity to log into the admin panel by enabling sharing the dashboard.
To enable sharing dashboard click the Share button in the toolbar. The pop-up will appear where you can enable sharing the dashboard.
After sharing for the dashboard is enabled the pop-up will show the quick access link and QR code by which you can access the current dashboard on any device.
Share the link to the dashboard or QR code with your colleagues so they'll be able to access the dashboard and see all the metrics in it at any time.
Change Log
1.4.8
(2026-06-09)
Features
- Added block configuration support for single-value goal tracking — a widget's goal target, goal type (fixed value or comparison period), and display style (ring gauge, half gauge, or progress bar) are now stored and served with the dashboard.
- Added block configuration support for the chart type (line, area, bar, stacked) and a per-widget icon, backing the new chart-type selector and widget icons.
1.4.7
(2026-05-04)
Fixed
- Fixed PHP 7.3 compatibility — fatal error from incompatible
selfreturn type declarations in block configuration setter methods
1.4.6
(2026-04-21)
Improvements
- Added i18n support for 15 core locales (ar_SA, cs_CZ, de_DE, es_ES, fr_FR, it_IT, ja_JP, nl_NL, pl_PL, pt_BR, pt_PT, sv_SE, tr_TR, uk_UA, zh_Hans_CN)
1.4.5
(2026-03-30)
Fixed
- Fixed the issue with allowing creation of incompletely configured block via REST API which leads to problems with opening related dashboard
1.4.4
(2026-03-26)
Improvements
- Reduced the possibility of date filter errors for REST API calls
1.4.3
(2026-03-12)
Fixed
- Fixed sort order not working in table-type blocks when data comes as
SortOrderInterfaceobjects (e.g., via REST API)
1.4.2
(2026-03-06)
Features
- Block-level REST API endpoints — add, update, or delete individual blocks on a board without rewriting the entire board configuration
Improvements
- Added admin controller to redirect directly to a specific board by ID
1.4.1
(2026-03-03)
Improvements
- ⚠️ Renamed REST API field
date_rangetotime_rangefor consistency with other report modules (old accessors still work but are deprecated)
1.4.0
(2026-02-26)
Features
- REST API for dashboards — full CRUD for boards and blocks via REST endpoints (
/V1/dashboard/boards,/V1/dashboard/board/:boardId,/V1/dashboard/board/:boardId/block/:blockIdentifier/execute) - ⚠️ Block config classes (
Block/Chart.php,Block/Single.php,Block/Table.php) removed — logic consolidated intoBlock/Config.phpimplementingBlockConfigInterface
Fixed
- Fixed boards being duplicated when admin URL secret key is enabled
1.3.22
(2026-01-08)
Features
- Configurable board ordering — set sort order per board and choose global sort field (title or creation date) and direction in system config under Dashboard settings
1.3.21
(2025-12-10)
Fixed
- Fixed single-value blocks showing incorrect values for lifetime date range when temporary/CTE tables are used
1.3.20
(2025-07-29)
Improvements
- Improved built-in widget templates with correct base tables and product dimension references
1.3.19
(2025-06-16)
Improvements
- Added translation/i18n support for frontend-shared dashboards
1.3.18
(2024-12-23)
Features
- Share dashboards on the storefront — boards can now be displayed on the Magento frontend, not just in the admin panel
- ⚠️ New
is_mobile_frontendcolumn added to themst_dashboard_boardtable
1.3.17
(2024-10-08)
Fixed
- Removed Mirasvit Bookmarker bar from mobile dashboard view
1.3.16
(2024-07-04)
Fixed
- Fixed PHP 8.x error "hash(): Argument #2 must be of type string, int given" when generating block and board identifiers
1.3.15
(2024-07-04)
Fixed
- Fixed error when attempting to duplicate a dashboard that has not been saved yet
1.3.14
(2024-04-25)
Fixed
- Fixed comparison data using the wrong config after changing a block's renderer type (e.g., from single value to chart)
1.3.13
(2024-04-15)
Fixed
- Fixed shared and mobile dashboards breaking when "Add Secret Key to URLs" is enabled in admin settings
1.3.12
(2024-03-29)
Features
- Configurable base table for table blocks — select which database table a table-type block queries, enabling better date filtering for cross-entity reports
1.3.11
(2024-03-15)
Features
- Save date range per board — each dashboard remembers its own selected time range
- ⚠️ New
date_rangecolumn added to themst_dashboard_boardtable
Improvements
- Duplicated dashboard is now automatically displayed after creation
1.3.10
(2024-03-04)
Features
- Duplicate dashboard — clone an existing board with all its blocks in one click
1.3.9
(2024-01-05)
Features
- HTML widget type — add custom HTML content blocks to dashboards
1.3.8
(2023-04-14)
Fixed
- Fixed date interval formatting in dashboard blocks sent via email notifications
1.3.7
(2023-04-04)
Fixed
- Fixed filters not being applied to dashboard widgets whose base table does not have a date column — previously all filters were skipped instead of just the date filter
1.3.6
(2023-03-15)
Fixed
- Fixed PHP 8.2 compatibility (dynamic property deprecation in API request controller)
1.3.5
(2023-02-06)
Fixed
- Fixed dashboard failing to save due to board lookup issue in repository
1.3.4
(2023-01-23)
Improvements
- ⚠️ Magento 2.4.6 compatibility — replaced deprecated
Zend_JsonandZend_Dateusage (requiresmirasvit/module-core>= 1.4.10)
1.3.3
(2022-12-29)
Fixed
- Fixed PHP 8.1 compatibility —
rand()type requirement in block identifier generation
1.3.2
(2022-06-20)
Improvements
- Removed
db_schema_whitelist.json(no longer needed with declarative schema)
1.3.1
(2022-05-10)
Improvements
- Added
db_schema_whitelist.jsonfor declarative schema support
1.3.0
(2022-05-10)
Improvements
- ⚠️ Migrated from legacy Install/Upgrade schema scripts to Magento declarative schema (
db_schema.xml) and data patches
1.2.49
(2021-05-13)
Fixed
- Fixed "toArray on null" error when changing a widget type to "table" in the block settings
1.2.48
(2021-04-15)
Features
- Predefined widget library — new blocks can be created from a set of built-in widget templates (orders, revenue, customers, products)
1.2.46
(2020-09-07)
Fixed
- Added error notification when saving board changes is not allowed for the current admin user
- Fixed dashboard not displaying due to premature JavaScript initialization
1.2.44
(2020-08-13)
Fixed
- Fixed mobile dashboard overlay blocking interaction
1.2.43
(2020-07-29)
Improvements
- Magento 2.4 compatibility
Fixed
- Fixed info display for boards with private type
1.2.42
(2020-02-04)
Improvements
- Added time range labels to dashboard widgets sent via email notifications
1.2.41
(2019-08-08)
Improvements
- Code quality improvements for Magento Extension Quality Program compliance
1.2.40
(2019-03-25)
Fixed
- Fixed error during
setup:upgradewhen updating to a new version
1.2.39
(2019-03-06)
Fixed
- Fixed "last year" comparison returning incorrect data
1.2.38
(2019-02-25)
Fixed
- Fixed date range override not being applied correctly to blocks
1.2.37
(2019-01-31)
Improvements
- Added comparison percentage values to email report notifications
1.2.36
(2019-01-30)
Improvements
- Added comparison values to email report notifications
1.2.35
(2018-12-27)
Fixed
- Fixed metrics comparison returning incorrect values
1.2.34
(2018-12-18)
Fixed
- Fixed email notifications failing to send dashboard reports
1.2.33
(2018-12-17)
Features
- Chart block type — display dashboard data as charts
1.2.32
(2018-12-11)
Fixed
- Fixed filters not being applied in email report notifications
1.2.31
(2018-12-06)
Fixed
- Fixed wrong dashboard being selected for mobile view
1.2.30
(2018-12-04)
Features
- Date range comparison — compare current period data with a previous period directly on the dashboard
Fixed
- Fixed date range override not saving correctly
1.2.29
(2018-11-30)
Fixed
- Fixed API request handling for dashboard block data
1.2.28
(2018-11-29)
Improvements
- ⚠️ Major UI rewrite — replaced the old UI component system with a new API-based interface. All old
Ui/,DataSource/, andRenderer/PHP classes removed and replaced with a streamlined controller-based API - Magento 2.3 compatibility
Fixed
- Fixed admin URL secret key breaking API requests
- Fixed table block filtering not working correctly
1.2.25
(2018-10-12)
Fixed
- Fixed widget settings not being applied after saving
1.2.24
(2018-10-10)
Improvements
- Added "like" and "not like" filter conditions to widget settings
1.2.23
(2018-10-02)
Fixed
- Fixed dashboard not visible on mobile devices
1.2.22
(2018-09-11)
Fixed
- Fixed resetting recent changes not working correctly
1.2.21
(2018-09-10)
Improvements
- Improved widget positioning logic for better layout control
1.2.20
(2018-08-15)
Fixed
- Fixed inability to remove a single dashboard
1.2.19
(2018-07-26)
Fixed
- Fixed metrics showing incorrect values for today/yesterday date ranges
1.2.18
(2018-07-25)
Features
- Table renderer in email reports — dashboard blocks using the table renderer are now included in email notifications
1.2.17
(2018-07-24)
Fixed
- Fixed records being filtered by wrong date column
- Fixed "Is not one of" filter operator using incorrect condition name
1.2.16
(2018-06-22)
Fixed
- Fixed "Area code is not defined" error during installation
1.2.15
(2018-06-19)
Improvements
- Table blocks now display only active report columns instead of all available columns
1.2.14
(2018-06-15)
Fixed
- Fixed empty metric data when editing older widgets created before the block config migration
1.2.13
(2018-06-14)
Fixed
- Fixed block settings panel not appearing due to missing component type specification
1.2.12
(2018-06-14)
Features
- Block-level filters and grid settings — configure filters and column visibility per block
- Block-level date comparison — each block can have its own comparison period independent of the dashboard
- Renderer-specific data — blocks return different data depending on the selected renderer type (single, table, chart)
Improvements
- Added second sparkline for comparison data visualization
- Time icon indicator for blocks with overridden date ranges
- Previously selected report columns are now remembered per block
1.2.11
(2018-05-02)
Improvements
- Dashboard blocks now auto-refresh every 2 minutes
Fixed
- Fixed inability to create new dashboard blocks
1.2.10
(2018-04-17)
Fixed
- Fixed error when opening dashboard
1.2.9
(2018-04-16)
Fixed
- Fixed compatibility with Magento 2.1
1.2.8
(2018-04-10)
Fixed
- Fixed "false" being displayed instead of table name in the Data field dropdown
1.2.7
(2018-04-04)
Fixed
- Fixed error when viewing dashboard due to null
created_atandupdated_atfields
1.2.6
(2018-03-30)
Fixed
- Fixed table-type dashboard blocks not displaying
- Fixed mobile dashboard requiring admin login when accessed via QR code
1.2.5
(2018-03-20)
Fixed
- Fixed dashboard showing no data when a single-day date range is selected
1.2.4
(2018-03-16)
Fixed
- Fixed date interval picker on dashboard toolbar not working correctly
1.2.3
(2018-03-07)
Fixed
- Fixed date handling in dashboard block queries
1.2.2
(2018-03-05)
Fixed
- Fixed error when attempting to create or modify a dashboard
1.2.1
(2018-02-13)
Fixed
- Fixed "toArray on null" error in data processing
1.2.0
(2018-02-05)
Features
- ⚠️ Complete architecture rewrite — replaced the old Widget system (Metric/Report widgets) with a new Block/DataSource/Renderer architecture. New drag-and-drop UI, new admin interface, new data providers. All old Widget classes removed
1.0.21
(2017-12-20)
Improvements
- Magento 2.0 compatibility
1.0.20
(2017-12-14)
Fixed
- Fixed
di:compileerror caused by missing class reference
1.0.19
(2017-12-10)
Fixed
- Fixed mobile dashboard requiring admin login when accessed via QR code
1.0.18
(2017-12-06)
Fixed
- Fixed error in dashboard controller preventing page from loading
1.0.17
(2017-11-07)
Features
- Store view filter for widgets — create metric widgets filtered to individual store views
Fixed
- Fixed "Process Orders" configuration option not being applied to metric widgets
1.0.16
(2017-10-03)
Improvements
- Magento 2.1.9 compatibility
1.0.15
(2017-08-22)
Features
- Abandoned cart metrics — added abandoned cart data to metric widget options
1.0.14
(2017-08-07)
Features
- Cart Reports widgets — added support for Cart Reports data in dashboard widgets
1.0.13
(2017-07-27)
Features
- Customer group filter for metrics — create metric widgets filtered to specific customer groups
Fixed
- Fixed price values not being formatted correctly in report widgets
1.0.11
(2017-06-07)
Fixed
- Fixed widget edit form not loading correctly
1.0.10
(2017-06-07)
Features
- Order status filter for metrics — added individual order status filter to metric widgets
1.0.8
(2017-06-06)
Improvements
- "Process Orders" configuration is now applied to metric widgets
Fixed
- Fixed product names not displaying in dashboard widgets
- Fixed order status filter not working for report widgets
1.0.7
(2017-05-12)
Fixed
- Fixed attribute ID being displayed instead of the attribute label in report widgets
1.0.6
(2017-04-18)
Fixed
- Fixed blank widgets in email notifications
1.0.5
(2017-04-13)
Fixed
- Fixed duplicate rows appearing in report widgets
1.0.4
(2017-04-05)
Fixed
- Fixed "No such widget" error when opening dashboard
1.0.3
(2017-04-05)
Features
- Ordered columns in report widget config — columns in the report widget configuration are now sorted alphabetically
Improvements
- Added loading spinner during dashboard initialization
1.0.2
(2017-03-31)
Features
- Mobile dashboard — view dashboards on mobile devices via QR code
Fixed
- Fixed error after removing a widget
1.0.1
(2017-02-20)
Improvements
- Improved metrics dropdown with better organization and labels
- Added email notifications with dashboard block data
- Added dashboard title display on widgets
Fixed
- Fixed widget type selection not appearing in widget form
- Fixed widget saving issues
1.0.0
(2017-01-31)
Features
- Initial release — customizable admin dashboards with metric and report widgets, drag-and-drop layout, mobile view, and email notifications