Welcome to the Advanced Reports Guide!
Here you will find everything you need to set up and use our Advanced Reports. Whether you're new or an advanced user, you can find some useful information here.
The Advanced Reports extension includes the following modules:
- Advanced Reports
- Advanced Dashboard
- Report Builder
With this extension you'll be able to display almost any data from your store in reports and/or dashboard widgets.
Go ahead, dive in!
Learn about the initial setup:
- Installation
- Quick Start
Installation
In this article, you will find two possible ways to install our extension.
Installation via composer (preferably)
We recommend this installation method because the composer automatically checks and installs necessary dependencies.
- Back up your store's database and web directory.
- Log in to your server's SSH console and navigate to the root directory of the Magento 2 store.
-
Copy the installation instructions from the page My Downloadable Products to the SSH console and press ENTER.
- To enable the extension, run commands:
php -f bin/magento module:enable Mirasvit_Core Mirasvit_Report Mirasvit_Reports Mirasvit_Dashboard Mirasvit_ReportBuilder php -f bin/magento setup:upgrade -
Clean the cache
php -f bin/magento cache:clean - Deploy static view files
    rm -rf pub/static/frontend/*
    rm -rf pub/static/backend/*
    rm -rf var/view_preprocessed/*
    php -f bin/magento setup:static-content:deploy
Installation via direct file upload
You can also install the extension via direct files uploading.
-
Go to My Downloadable Products / View & Download.
- Unpack the .zip package and copy the contents to Magento's root directory
- Login to your server's SSH console and navigate to the root directory of the Magento 2 store.
- To enable the extension, run commands:
php -f bin/magento module:enable Mirasvit_Core Mirasvit_Report Mirasvit_Reports Mirasvit_Dashboard Mirasvit_ReportBuilder php -f bin/magento setup:upgrade -
Clean the cache
php -f bin/magento cache:clean - Deploy static view files
    rm -rf pub/static/frontend/*
    rm -rf pub/static/backend/*
    rm -rf var/view_preprocessed/*
    php -f bin/magento setup:static-content:deploy
Learn about the initial setup:
- Quick Start
Quick Start
As you have completed the installation of Advanced Reports, we will guide you through the main steps required to start using our extension efficiently.
-
Please open and configure your first Advanced Dashboard (Magento Main Menu > Dashboard > Advanced Dashboard)
- Please check the Reports (Magento Main Menu > Reports > Advanced Reports)
General Configurations
All configurations of the Advanced Reports extension are located at Stores -> Configuration -> Mirasvit Extensions -> Advanced Reports.
The extension has only one setting - Order Status. This setting defines which order statuses will be pre-selected as a filter for all reports and dashboard blocks.
Managing Reports
Reports Overview
The Advanced Reports extension offers a comprehensive range of tools for analyzing and improving sales through a variety of reports. This extension enables the display of composite reports for all websites, as well as separate reports for each store.
The extension provides a selection of predefined reports that are particularly useful for most Magento stores. The information about these reports can be found here.
Each report can be customized using the Report Builder tool. Additionally, it is possible to create custom reports by copying and modifying predefined reports.
The extension is capable of displaying nearly any data from the store's database. It also allows the calculation and aggregation of data on the fly, according to specific requirements, through the Config Builder tool.
Interface
While the interface of the reports may appear different from the native grids in the admin panel, the navigation and tools remain similar, ensuring that managing the reports is easy and intuitive.
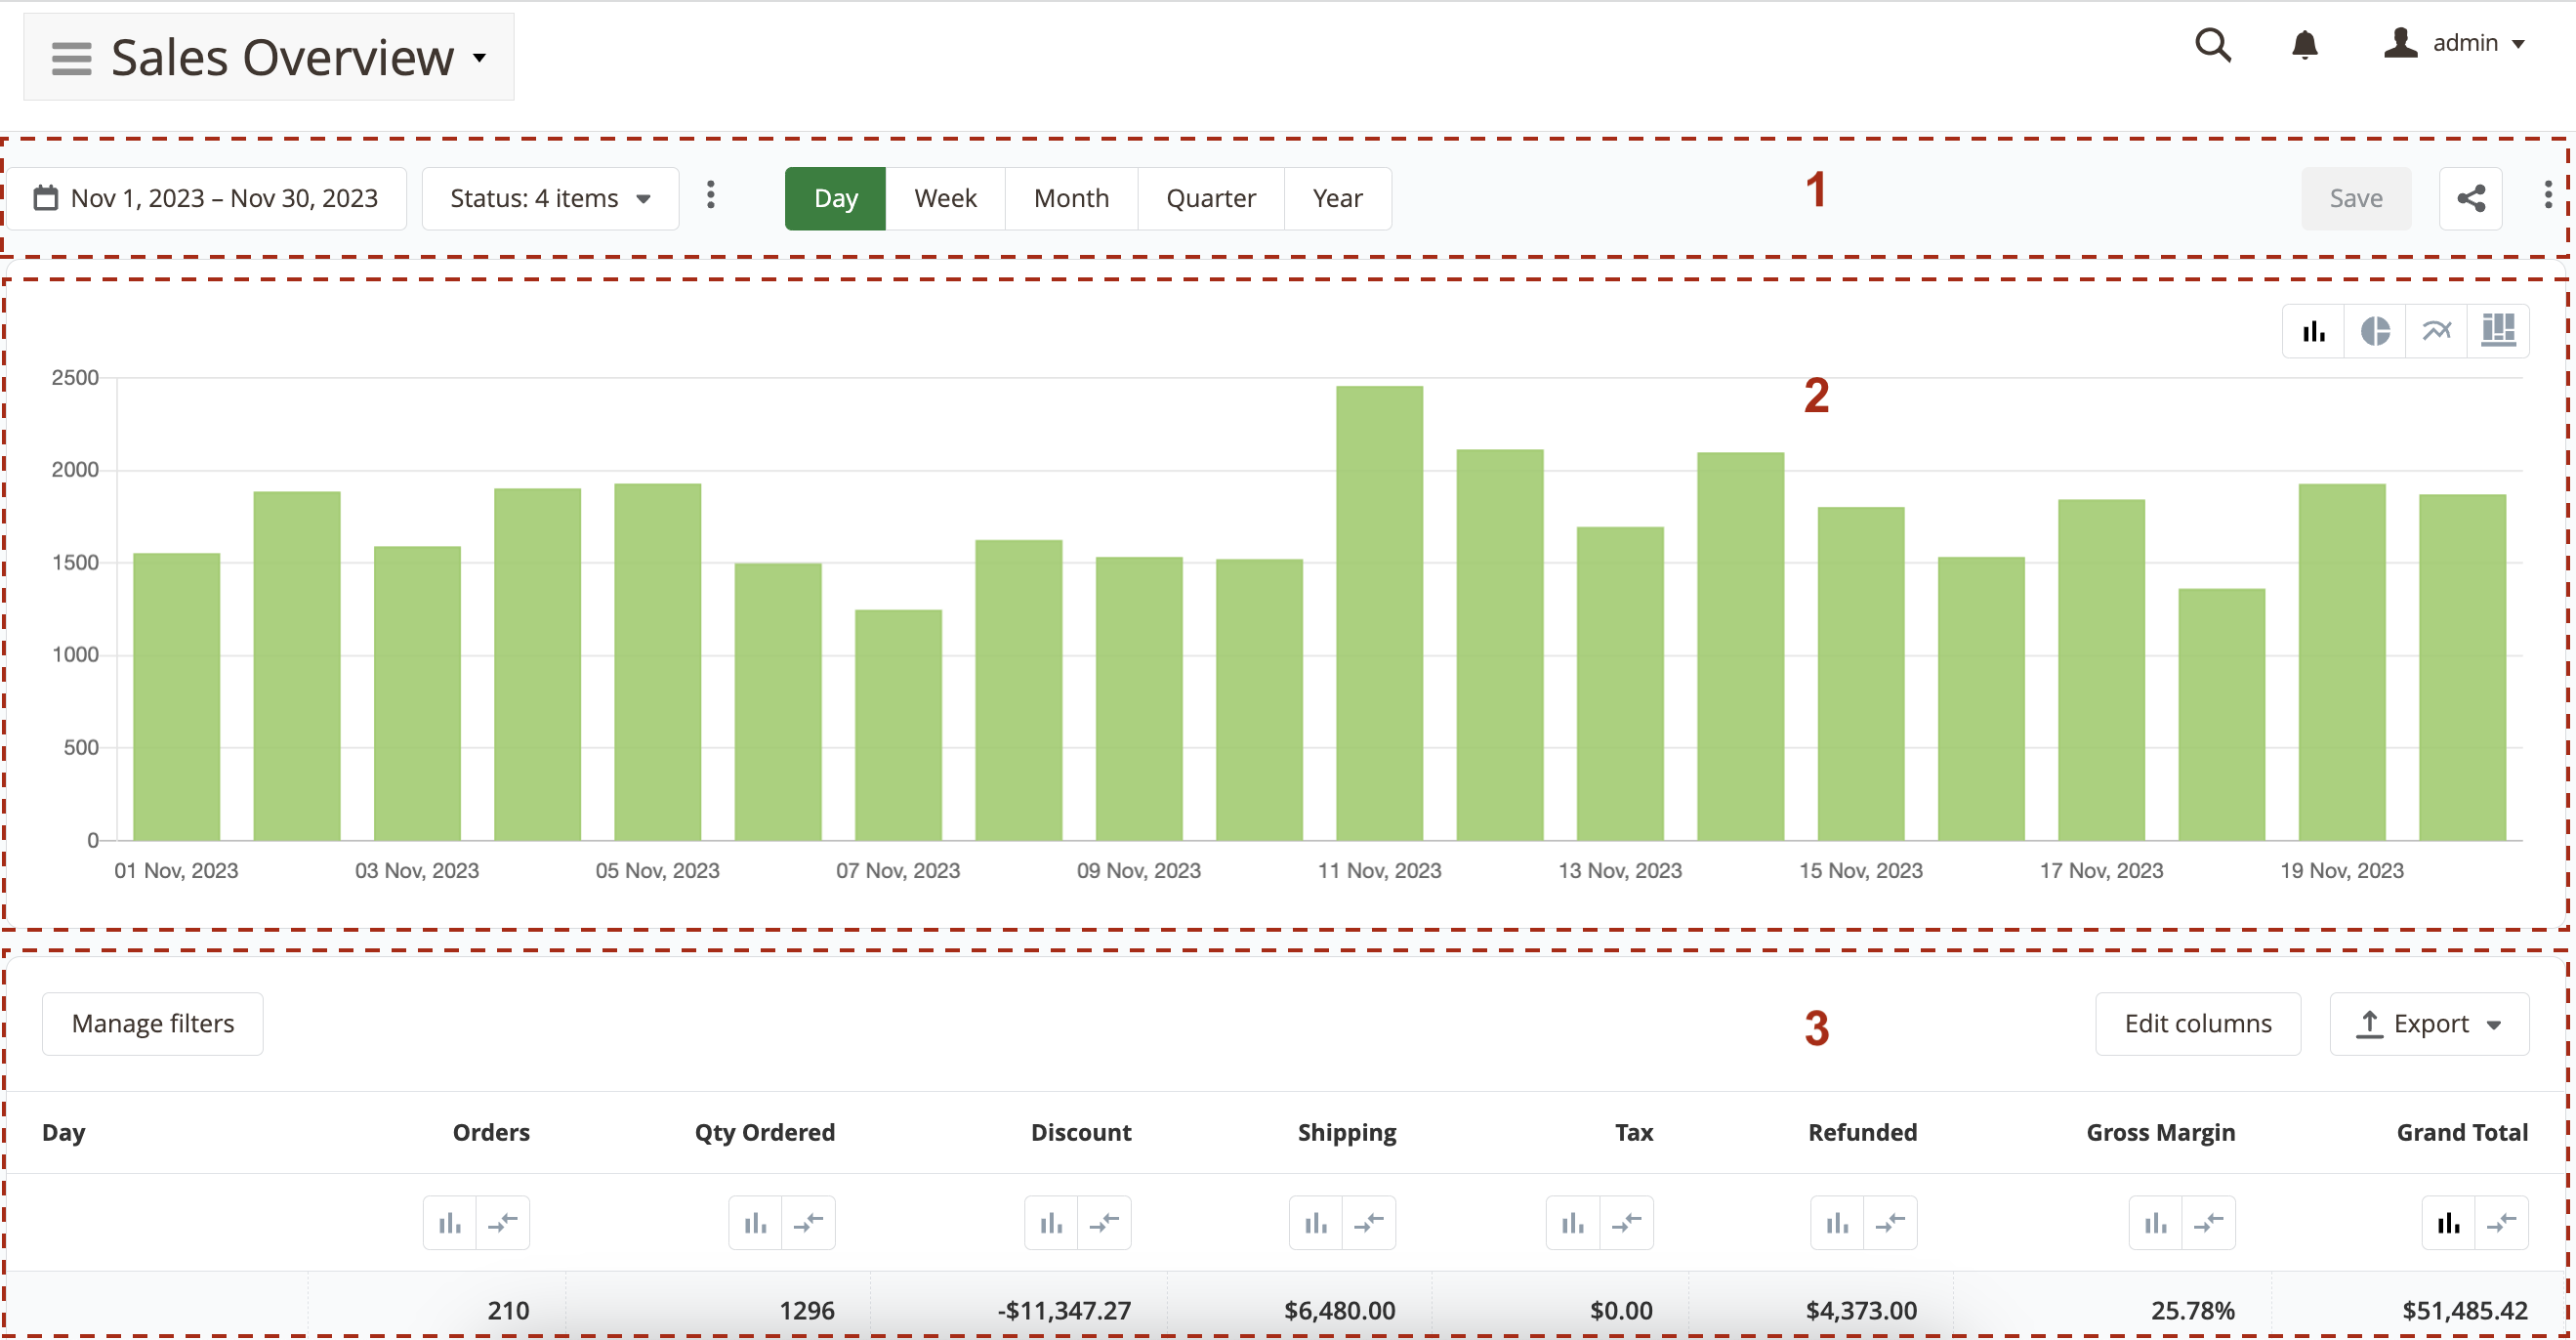
Each report interface consists of three main sections:
-
Toolbar - this section contains primary filters and report control buttons, including options to save, share, and edit the report. Here, users can select the time range of the report and apply primary filters defined in the Report Builder. It is possible to save the report state after making changes and enable/disable sharing. The Save, Share, and Edit buttons can be hidden for specific admin users using User Role Permissions settings. Further information can be found here.
-
Chart - this section allows users to visualize the data in the report using various types of charts. Users can switch between different chart types using the chart toolbar located in the top right corner of this section. In some reports, the chart section may be hidden. To display the chart, users can select the columns for which they would like to visualize the data by clicking the corresponding button near the column in the reports section.
-
Report - this section contains the actual report. It is divided into two inner sections - the toolbar and the report area.
-
In the toolbar section, users can filter the report by columns from the report itself or add additional filters. Users can also change the columns displayed in the report and export the report in CSV or XML format.
- In the report area section, users can change the column by which the data in the report are sorted and the direction of the sort order. The number of rows displayed per page can also be adjusted using the pager toolbar at the bottom of the report area.
-
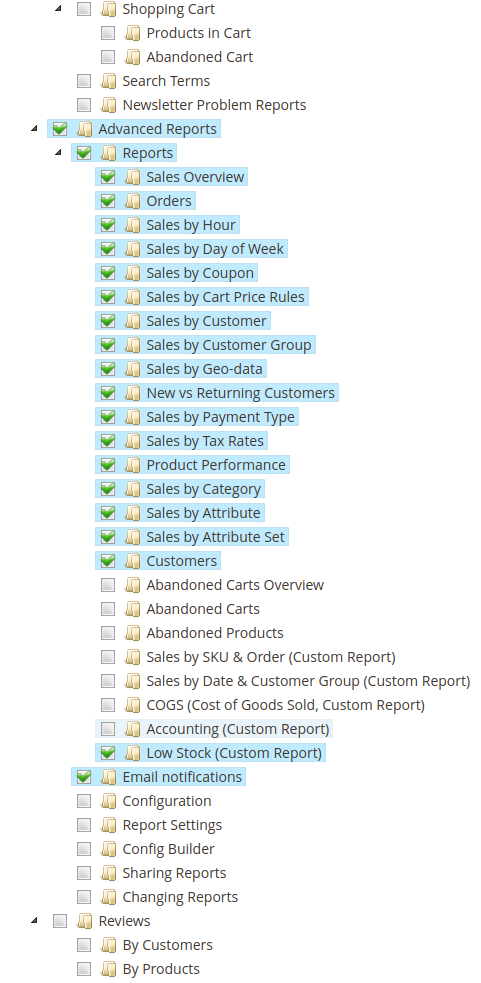
Predefined Reports
The Advanced Reports extension comes with a bunch of predefined reports that will be helpful to monitor and analyze sales data for most Magento stores.
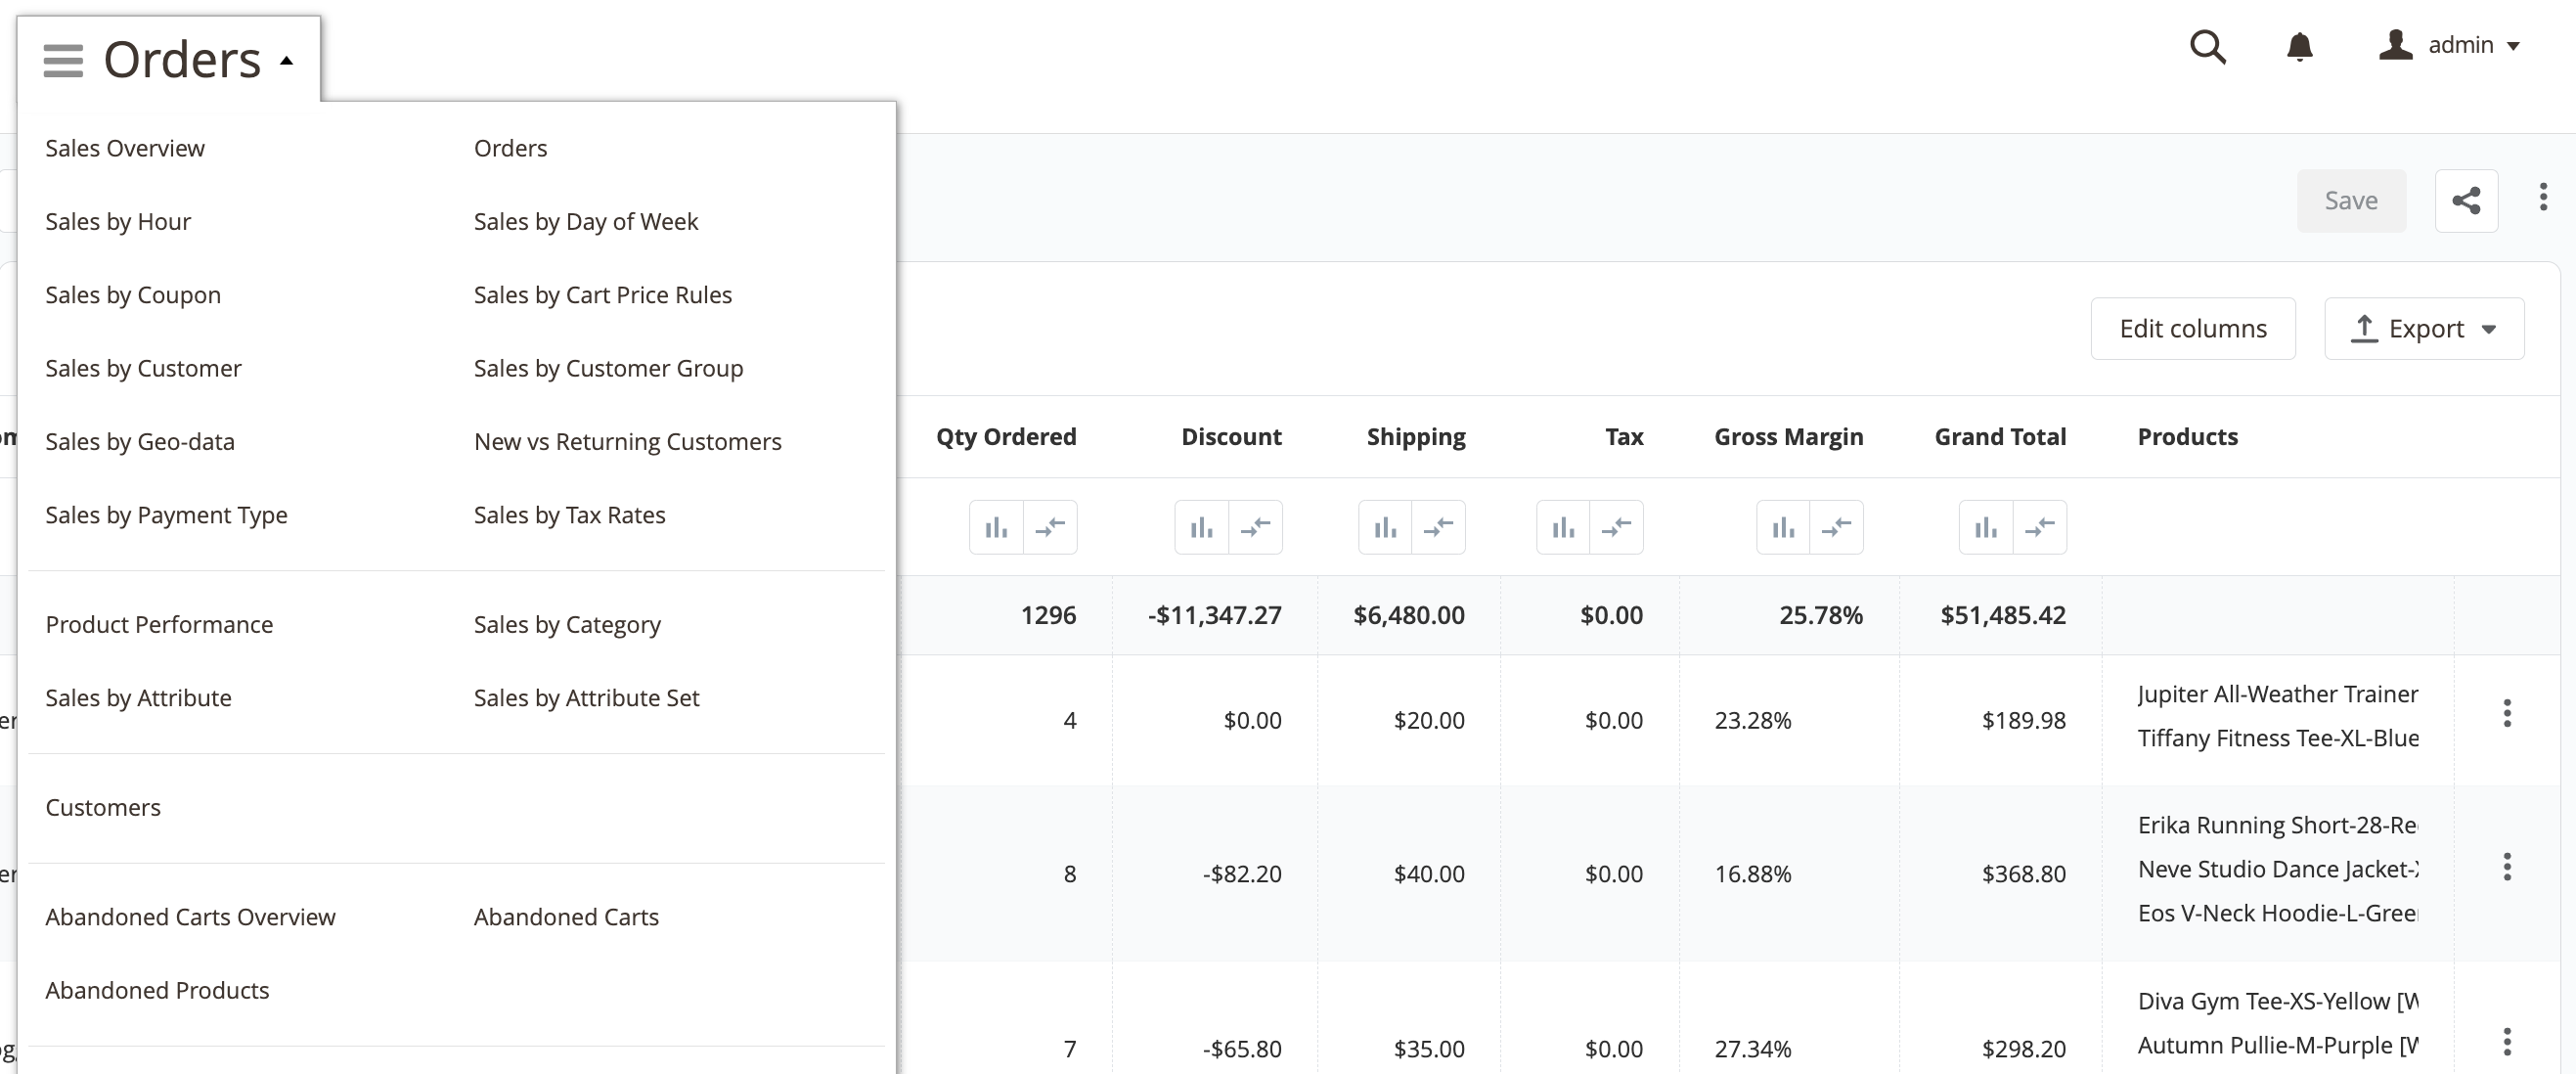
Predefined reports are separated into groups according to their purposes:
- Sales Reports - reports based on the orders data
- Sales Overview - general sales report. It allows you to see the number of orders, the quantity of sold products, net sales, total, discounts, and returns.
- Orders - the report gives full information about store orders.
- Sales By Hour - hourly sales report. You can detect the number of hours based on whether the personnel of your shop are being utilized to the maximum extent. It will allow you to plan the working hours and perform possible updates necessary for your shop.
- Sales by Day of week - weekly sales report.
- Sales by Customer - a report with details of sales to each customer can be found in your store. This allows you to view the required information about sales to all customers: the number of orders, refunds, and discounts, etc.
- Sales by Customer Group - sales by Customer Group refers to the sales report generated from different user groups. Using such a tool, you can determine the extent of work efficiency with different user groups.
- Sales by Coupon - the report allows you to gain knowledge regarding which of the coupons are most favorable in terms of sales volume, and which should be elaborated in a better way.
- Sales by Cart Price Rules - the report shows the rules guiding the use of cart prices.
- Sales by Tax Rate - the report contains information about the distribution of orders based on tax rates.
- Sales by Payment Type - the report allows you to define the degree of popularity from different payment methods.
- Sales by Geo-data - the report reflects the sales volumes in different countries achieved during a definite period.
- New vs Returning Customers - the report allows you to compile a comparative analysis of sales by new customers (those who have just placed their first order) juxtaposed against sales by returning customers (those who have already made two or more orders)
- Product-based Reports - reports based on the sold items data
- Product Performance - detailed information about each product's sale history: number of orders (%), ordered qty, the total amount of income, etc
- Sales by Category - sales report by store product categories
- Sales by Attribute - sales report by store product attributes
- Sales by Attribute Set - sales report by store product attributes
- Customer-based Reports
- Customers - the report contains all general information and statistics about registered customers.
- Abandoned Cart Reports - reports based on the data from abandoned carts
- Abandoned Carts Overview - the report contains statistics on abandoned carts. Information can be grouped at different time intervals (day / week / month / quarter / year).
- Abandoned Carts - this report contains a list of abandoned carts with information about their creation date, customer, coupon (if applied), and products.
- Abandoned Products - contains detailed information about abandoned products, letting you identify the most frequently abandoned products.
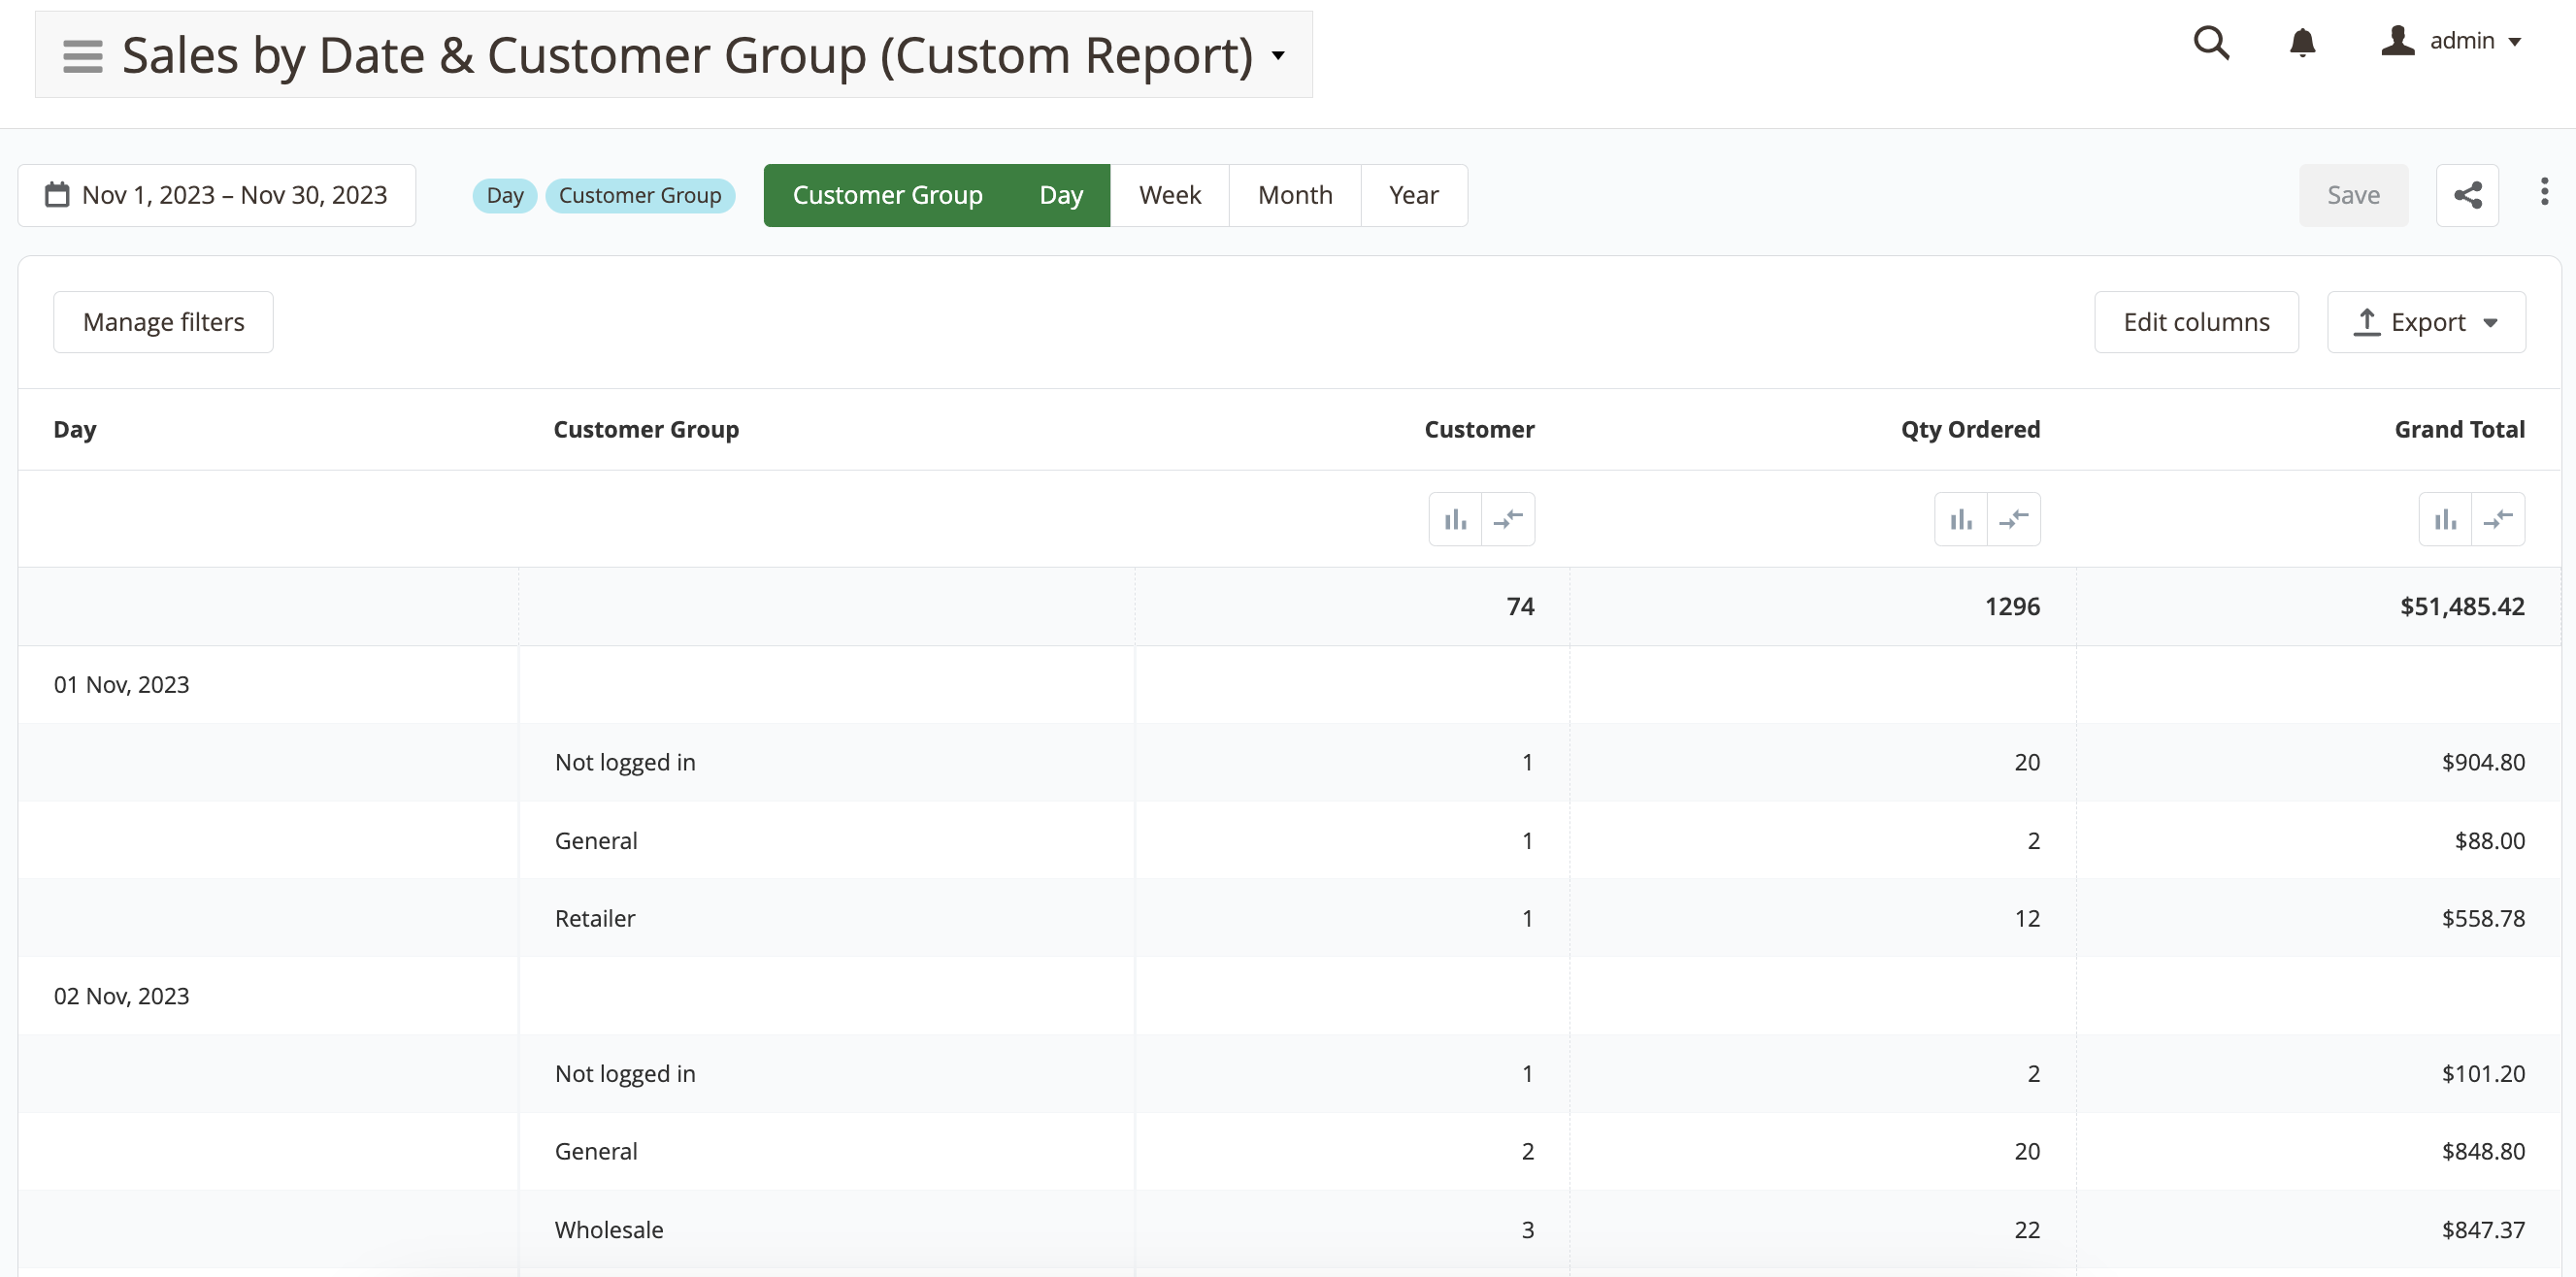
Custom Reports
This section provides a few common reports built with the Report Builder tool.
You can find out how to exact the configuration reports in our demo.
Low Stock Report
The Magento 2 Low Stock Report contains a list of all products with a stock quantity that is lower than the designated minimum level.
Cost of Goods Sold Report
The Magento 2 COGS Report (Cost of Goods Sold) contains a list of all purchased products, their quantity, and cost.
Stock Value Report
The Magento 2 Stock Value Report contains a list of all products with their stock quantity and each products' cost.
The stock value report is very useful when you need to know the specific quantity of stock you have for specific products and their total value.
Report Builder
The Report Builder is an innovative tool that enables users to modify existing reports or create their own customized reports.
The Report Builder is available for both pre-defined and custom reports. The only difference is that pre-defined reports cannot be completely removed. If a pre-defined report is customized and then deleted, the report will be reset to its initial state. Conversely, custom reports can be permanently removed by pressing the delete button without the ability to restore them.
To create a custom report based on a pre-defined report, open the dropdown menu in the top right corner of the toolbar on the report page and click on the Make a copy link.
Editor
To access the Report Builder, open the dropdown menu in the top right corner of the toolbar on the report page and click on the Edit report link.
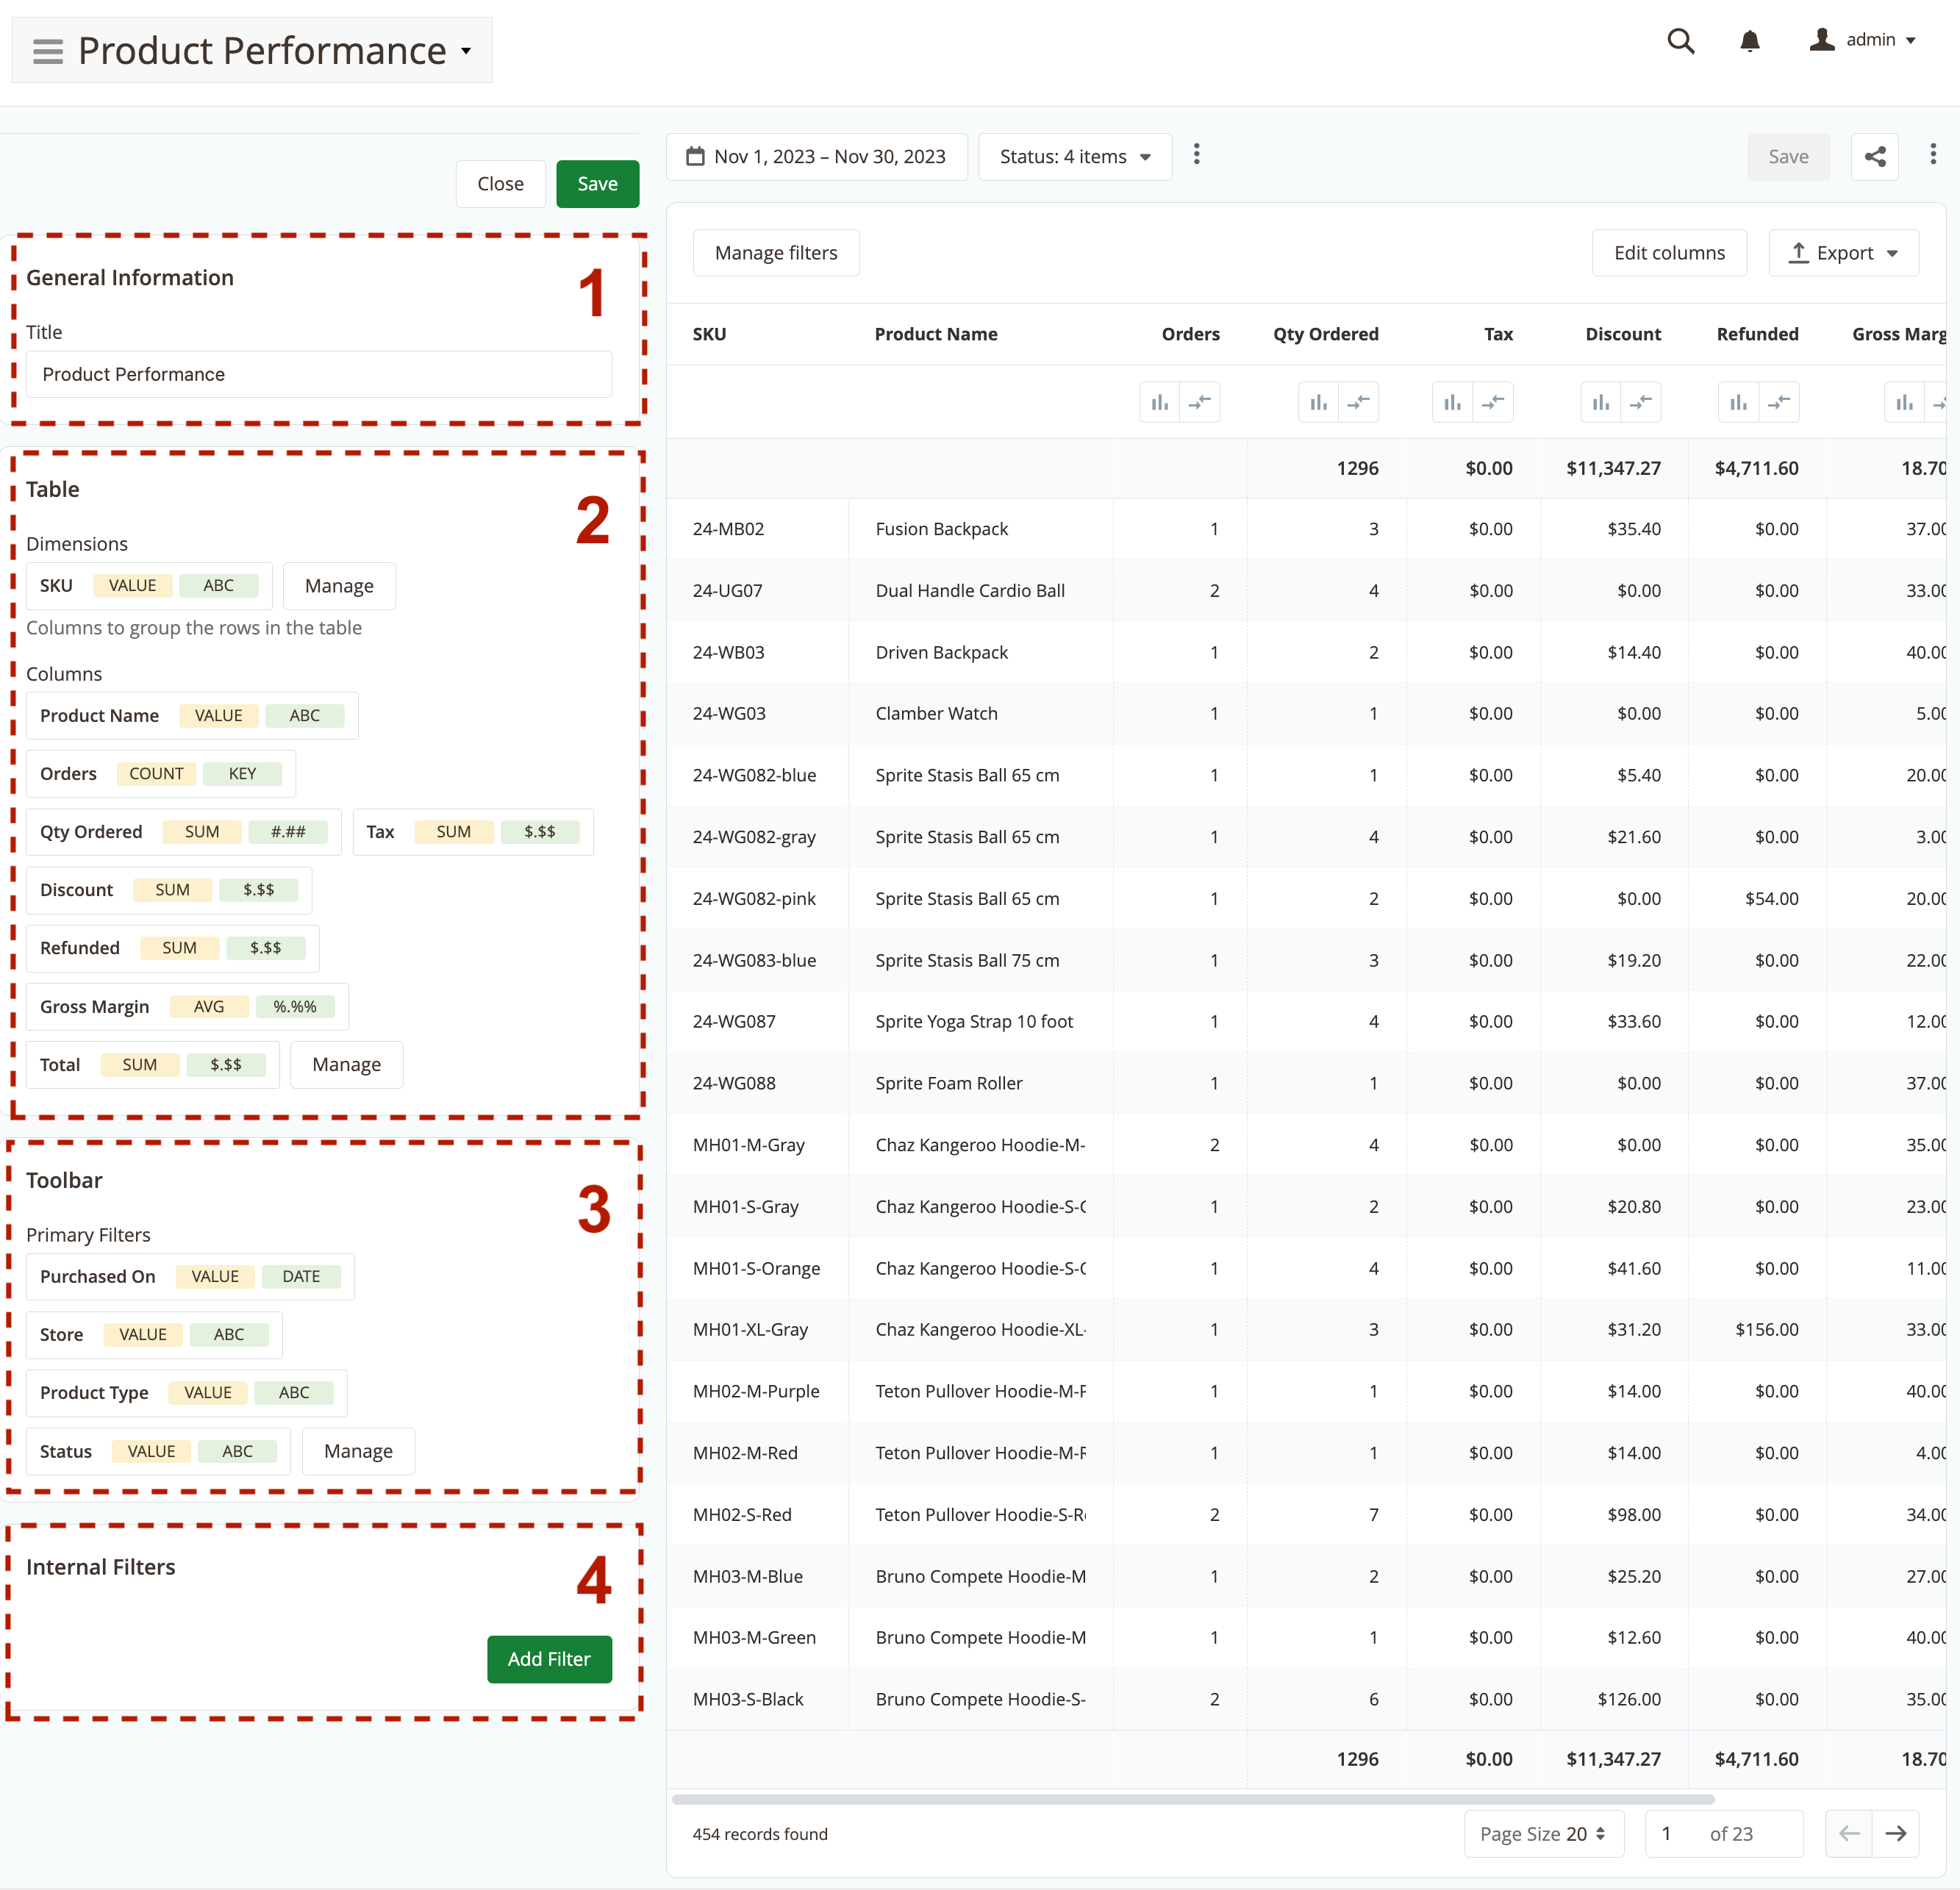
The interface of the Report Builder consists of two main sections: the Config section and the Preview section.
The Preview section (on the right) is useful for checking how the report will look before saving it.
The Config section (on the left) is used for configuring the report and is subdivided into four inner sections, each responsible for configuring different parts of the report:
- General Information - set the title of the report, which will appear in the Reports menu.
- Table - main report configuration. This section determines what will be displayed in the report and how it will be presented. It includes the following settings:
- Dimensions - specify the primary fields of the report using the Columns Chooser. Dimensions are the fields by which the data in the report will be grouped. They also define the default sort order of the report. The first field in the dimensions setting defines the base table of the report. If multiple dimensions are selected, the extension will not display duplicated values for dimension columns but will fill the row with empty cells (except the dimension value) and insert values for other columns in the next row.
- Columns - choose the columns to display in the report using the Columns Chooser. It is important to pay attention to the tables from which you are choosing columns for each report and for aggregations in those columns. Some tables may have columns with identical names, but the data in those columns will be different, which can affect the overall accuracy of the report.
- Dimensions - specify the primary fields of the report using the Columns Chooser. Dimensions are the fields by which the data in the report will be grouped. They also define the default sort order of the report. The first field in the dimensions setting defines the base table of the report. If multiple dimensions are selected, the extension will not display duplicated values for dimension columns but will fill the row with empty cells (except the dimension value) and insert values for other columns in the next row.
- Toolbar - configure which primary filter will be displayed in the toolbar section of the report page.
- Internal Filter - filter the report by adding filters and their corresponding values in this section. Filters added in this section will always be applied to the report, but they will not be visible on the report's page.
Columns Chooser
When configuring filters in the Table, Toolbar, or Internal Filter sections and clicking on the Manage or Choose Filter button, the Columns Chooser popup will open.
This popup allows users to manage columns for each section of the Config section in the Report Builder.
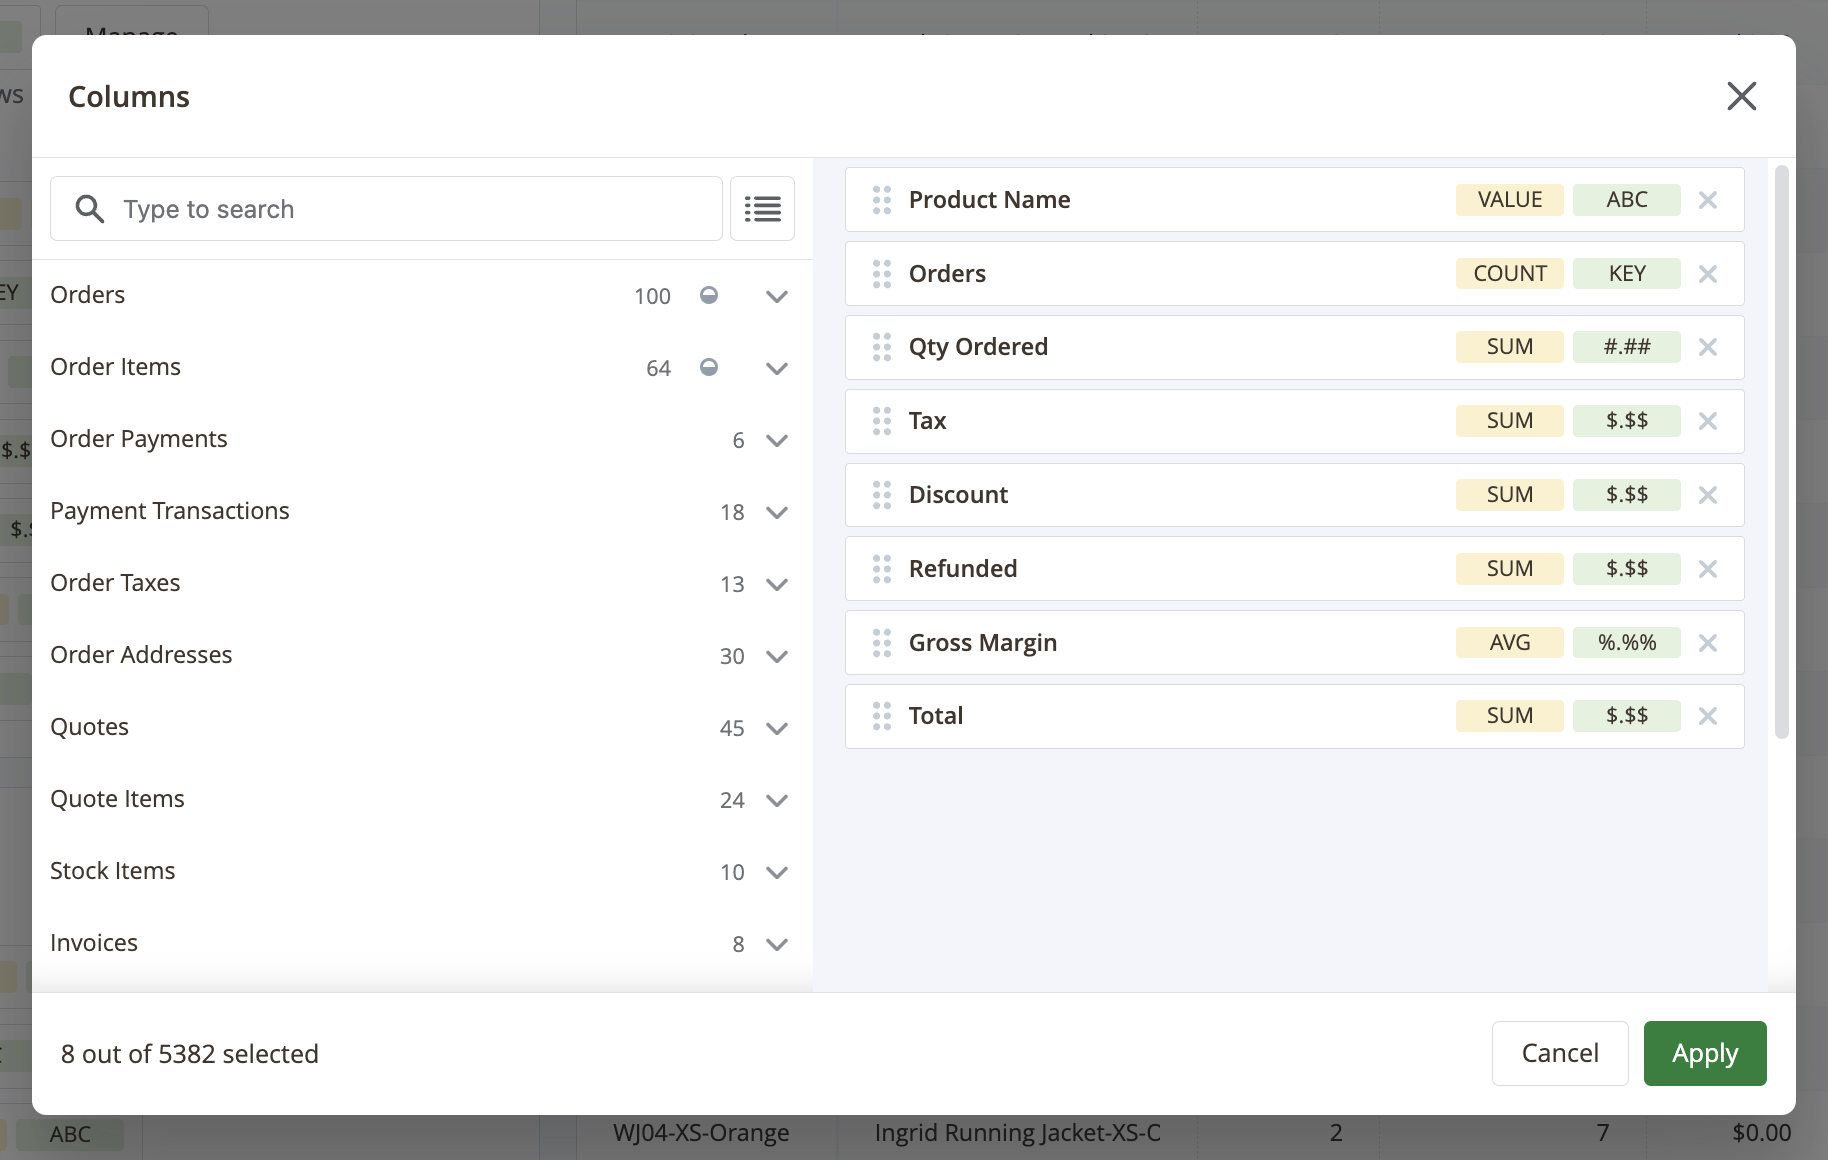
The columns in this popup are organized into groups, which mostly correspond to the tables to which those columns belong. Users can use the search bar to easily find the column they want to add to the report. If the column is not present or cannot be found using the search bar, it is likely that the column is not registered in the extension. In such cases, users can switch the Columns Chooser to advanced mode and try to find the column by its name in the database.
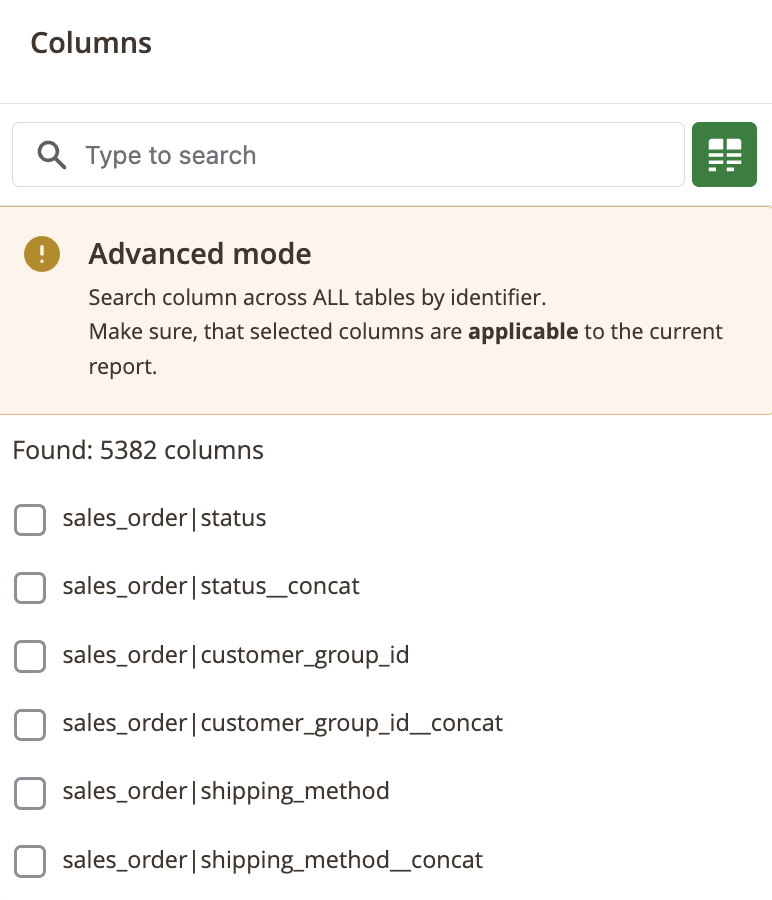
If the column or the entire table to which the column belongs cannot be found, users will need to create configurations for this column using the Config Builder provided by our extension.
Config Builder
Predefined reports provided by the extension and Report Builder can cover most cases for analyzing sales in a simple Magento store. However, the real stores and types of items they sell may require more advanced and flexible tools to analyze different parts of their sales. Also, real stores can have a lot of 3rd-party extensions with their own database tables that contain important data for sales/marketing/inventory analytics.
The Config Builder is exactly the tool for such purposes. It is located in Reports -> Advanced Reports -> Config Builder.
The Config Builder provides the ability to create Synthetic columns with complex data calculation/aggregation and to adjust relations between the native Magento database tables and tables from a 3rd-party or custom extension so the data in reports will be as accurate as possible.
Config Builder Overview
Open either the Report Builder or Config Builder menu, and select the Add New Config action on the right menu section. You will be brought to the Config Workspace:
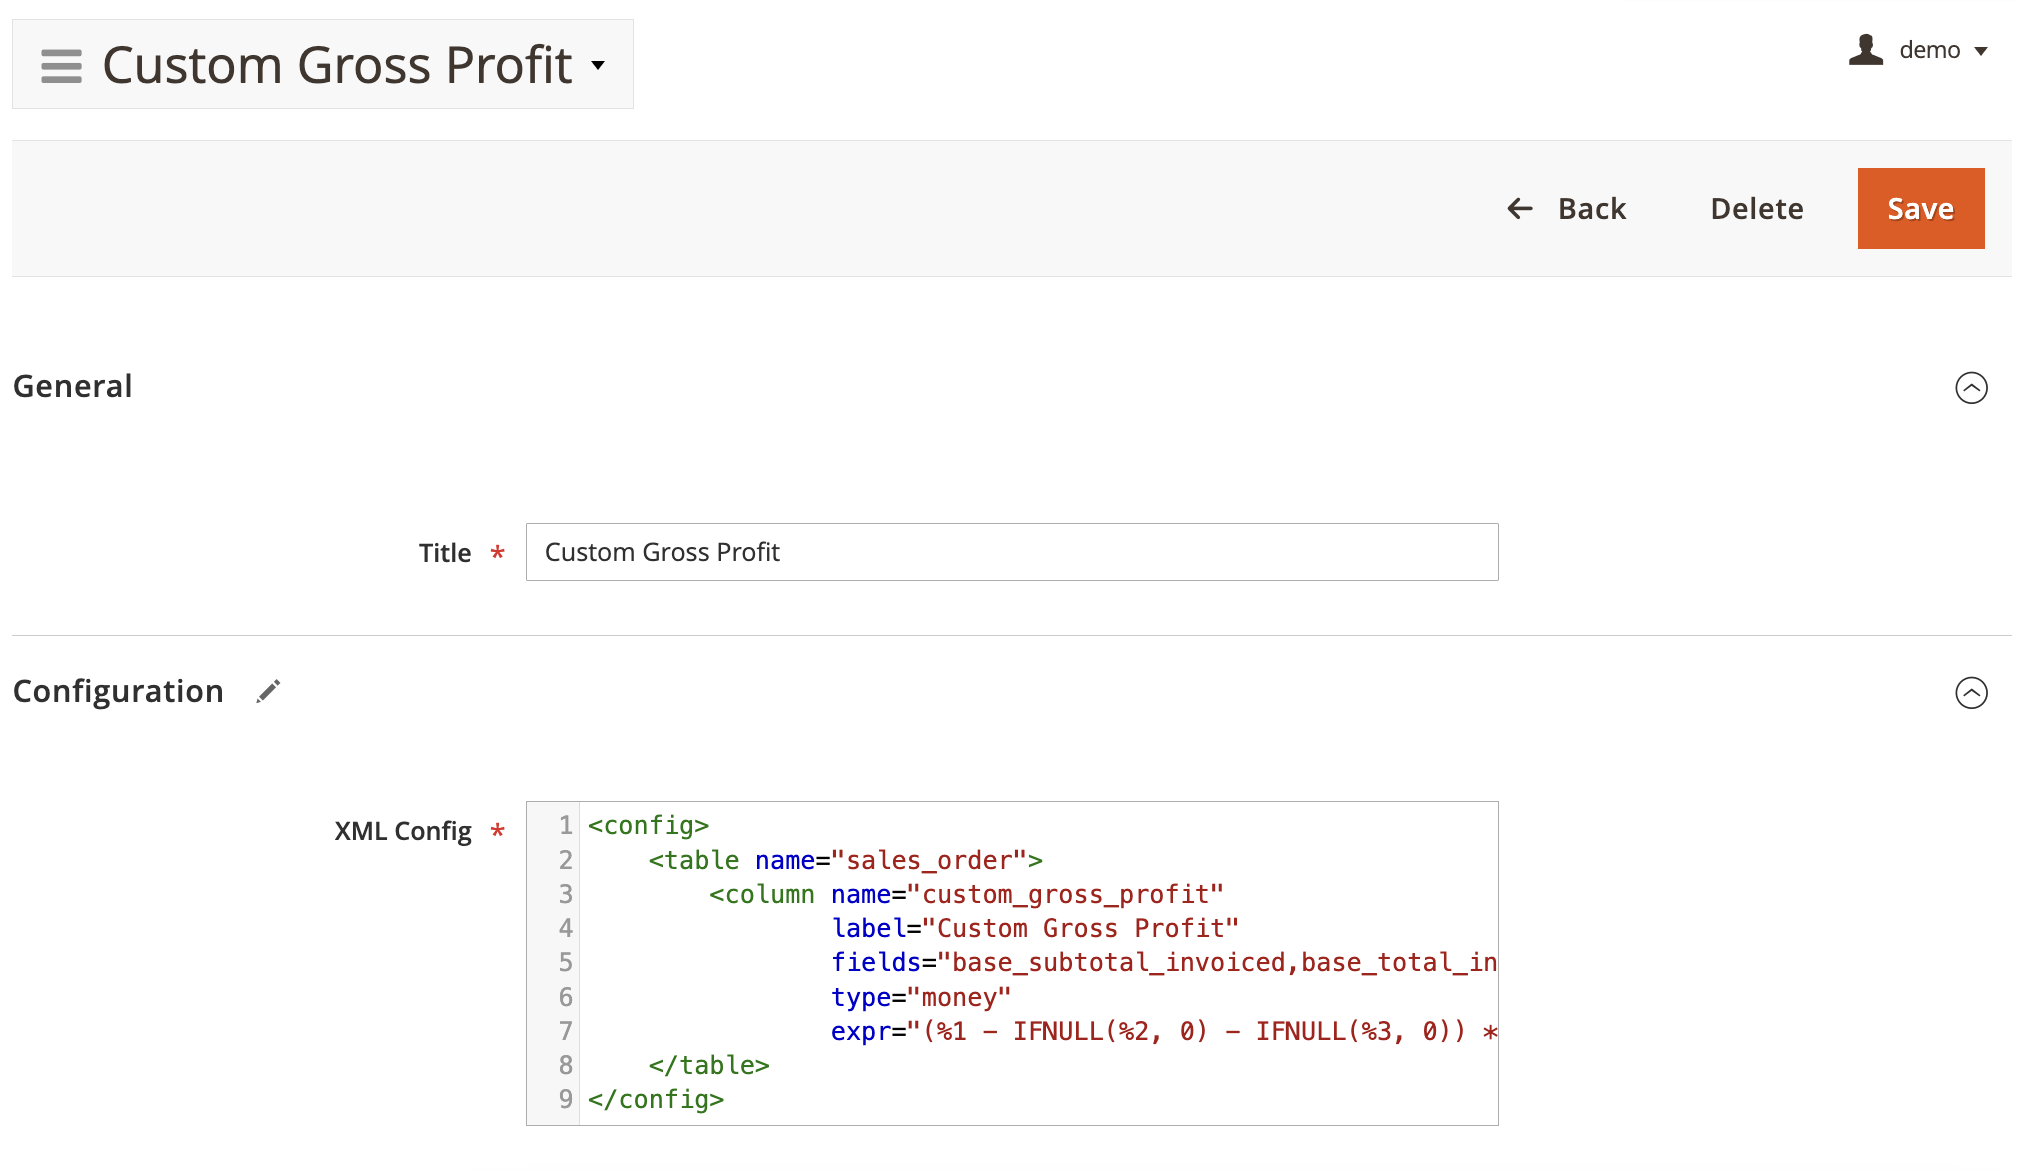
It is very simple and contains the following fields:
- Title - the new synthetic field's name (named whatever you wish).
- XML Config - column definition as XML document.
The Structure of the XML Config
config
This is the root element, e.g. all other tags should be contained inside it.
There are only 3 possible nodes allowed inside the config element - <table />, <eavTable />, <relation />.
table
This element must be used for registering tables so the extension will be able to retrieve data from them.
This element also can be used for already defined tables to assign custom synthetic columns to them.
Allowed child elements: <pk />, <fk />, <column />.
Attributes:
| Attribute | Description | Required | Default |
|---|---|---|---|
| name | name of the table. The name should be specified without the table prefix. This means that if you have in your database a prefix like mage_ and real table name mage_sales_order, you need to enter here just sales_order |
required | none |
| group | name of a group, under which this table appears in the Report Builder. Default values: Sales, Products, Customers, Categories, Other. |
optional | Other |
| label | the label of a table that is used in identifying a table. | optional | the value of the name attribute |
eavTable
This element must be used for registering EAV tables so the extension will be able to retrieve data from corresponding EAV entities including their attributes.
This element SHOULD NOT be used for native EAV tables like catalog_product_entity, catalog_category_entity, customer_entity, etc as these EAV entities are already registered in the extension.
Allowed child elements: <pk />, <fk />, <column />.
Attributes:
| Attribute | Description | Required | Default |
|---|---|---|---|
| name | name of the table. The name should be specified without the table prefix. This means that if you have in your database a prefix like mage_ and real table name mage_sales_order, you need to enter here just sales_order |
required | none |
| group | name of a group, under which this table appears in the Report Builder. Default values: Sales, Products, Customers, Categories, Other. |
optional | Other |
| label | the label of a table that is used in identifying a table. | optional | the value of the name attribute |
| type | the type code of the EAV entity. The code can be found in the entity_type_code column in the eav_entity_type table |
required | none |
pk
The primary key of the table. This element is optional and SHOULD NOT be used on native tables.
Attributes:
| Attribute | Description | Required | Default |
|---|---|---|---|
| name | the name of the primary key column | required | none |
| label | the labels for the column | optional | the value of the name attribute |
fk
The foreign key is in the table. This element is optional and SHOULD NOT be used on native tables.
Attributes:
| Attribute | Description | Required | Default |
|---|---|---|---|
| name | the name of the foreign key column | required | none |
| label | the labels for the column | optional | the value of the name attribute |
| table | the relation table name without prefix | required | none |
column
This element is responsible for defining the column. This element is mostly used for synthetic columns with custom calculations.
Attributes:
| Attribute | Description | Required | Default |
|---|---|---|---|
| name | the name of the primary key column | required | none |
| label | the labels for the column | optional | the value of the name attribute |
| type | data type of the column's value. The type defines how the value of the column will be displayed and possible aggregations for the column. The extension will automatically add columns with aggregations to the Column Chooser. Supported types: money, country, date, qty, number, select, percent, store, html. More information about data types you can check here |
optional | html |
| fields | comma-separated list of fields, which will be used in calculations | optional | if omitted the value from the name field will be used |
| expr | this attribute contains MySQL expression to calculate field value. You can use placeholders, where %1 corresponds to the first field in the previous attribute, %2 - to the second, and so on. |
optional | %1 |
| options | non-mandatory attribute where the data type select or country is used. Here you need to enter the full name or the class that implements the method toOptionArray for this column. |
optional | none |
| tables | comma-separated list of table names (without prefix) for the ability to include columns from other tables inside the expr field | optional | none |
| Type | Description | Aggregators |
|---|---|---|
| html | Simple string, Output values as it is | JOIN |
| number | Number rounded to 2 decimal points | SUM, AVG |
| qty | Integer value, mostly used for ID fields | COUNT |
| percent | Value formatted as a percentage with % symbol, rounded to 2 decimal points |
AVG |
| money | Currency format, displays numbers with currency symbol, rounded to 2 decimal points. If the report is filtered by one particular store the value will be displayed in the default currency for that store. Otherwise, the default store currency will be used | SUM, AVG |
| date | Date format, Depending on the aggregation type the output may vary | HOUR, DAY, DAY OF WEEK, MONTH, QUARTER, YEAR |
| select | The type for the field with predefined variations for values. With this type, the options attribute SHOULD be used in the column element |
JOIN |
| country | Similar to the select type. If the value of the column is in the ISO 3166-1 alpha-2 format then class Mirasvit\Report\Config\Source\Directory\Country can be used as the value of the options attribute in the column element |
JOIN |
| store | Similar to the select type but store labels will be retrieved by the extension so the options attribute SHOULD NOT be used along with this data type |
none |
relation
The module should determine how to link different tables to build reports from multiple tables.
The connection between two or more tables is called a table relationship.
The < relation /> element is responsible for defining relations between tables.
Required child elements: <leftTable />, <rightTable />, <condition />.
Attributes:
| Attribute | Description | Required | Default |
|---|---|---|---|
| name | the name of the relation. the name can be any string but it is recommended to use the following format: leftTable-rightTable |
required | none |
| type | the type of the relation between tables. Possible values: 11 - one to one; 1n - one to many. |
required | none |
leftTable, rightTable
This element is responsible for defining tables in the relation in the next format: <leftTable>sales_order_item</leftTable>.
The table name should be specified without the table prefix. These elements don't have attributes.
condition
This element is responsible for defining JOIN conditions between leftTable and rightTable using MySQL syntax.
You can use placeholders %1 and %2 where %1 is a placeholder for the letTable and %2 - for the rightTable
Config Examples
Simple Synthetic Field Config
A synthetic field that calculates the Gross Profit on the fly based on the actual invoiced orders.
<config>
    <table name="sales_order" group="Sales" label="Orders">
        <column name="custom_gross_profit"
                label="Custom Gross Profit"
                fields="base_subtotal_invoiced,base_total_invoiced_cost,base_total_refunded,base_to_global_rate"
                type="money"
                expr="(%1 - IFNULL(%2, 0) - IFNULL(%3, 0)) * %4" />
    </table>
</config>
Multi-table Synthetic Field
A synthetic field that calculates the Total (row total) for items in the cart.
This config is a part of the already defined config for the table qoute_item and is given here only as an example.
<config>
    <table name="quote_item" label="Quote Items" group="Sales">
        <column name="row_total"
                label="Total"
                fields="base_row_total"
                type="money"
                expr="%1 * IF(quote.base_to_global_rate > 0, quote.base_to_global_rate, 1)"
                tables="quote"/>
    </table>
</config>
Simple Relation Config
The example of building a relationship between sales_order and sales_order_item tables.
<config>
    <relation name="sales_order-sales_order_item" type="1n">
        <leftTable>sales_order_item</leftTable>
        <rightTable>sales_order</rightTable>
        <condition>%2.entity_id=%1.order_id AND %1.parent_item_id IS NULL</condition>
    </relation>
</config>
Config for Shipment Date per Item
The config with relations and synthetic column to display the shipment date for each item in the order even if items from the order were shipped separately.
At first, the sales_shipment_item table needs to be registered in the extension.
Then necessary relations are adjusted to properly connect items in the cart with shipment tables. After the Shipment Date column is defined in the sales_shipment table (to give a self-explanatory label for the column, this part is optional).
<config>
    <table name="sales_shipment_item" group="Sales" label="Shipment Item">
        <pk name="entity_id"/>
        <column name="parent_id" label="Shipment Id"/>
        <column name="order_item_id" label="Order Item Id"/>
    </table>

    <relation name="sales_order_item-sales_shipment_item" type="11">
        <leftTable>sales_order_item</leftTable>
        <rightTable>sales_shipment_item</rightTable>
        <condition>%1.item_id=%2.order_item_id</condition>
    </relation>

    <relation name="sales_shipment-sales_shipment_item" type="11">
        <leftTable>sales_shipment</leftTable>
        <rightTable>sales_shipment_item</rightTable>
        <condition>%1.entity_id=%2.parent_id</condition>
    </relation>

    <table name="sales_shipment" group="Sales" label="Shipment">
        <column name="shipped_at" label="Shipment Date" fields="created_at" type="date"/>
    </table>
</config>
EavTable Config Example
This config defines the EAV entity table and automatically adds columns for all attributes related to this entity.
This example includes the primary key field, the foreign key to connect customer_entity table with customer_address_entity table (in this case, another EAV entity), and the column of the type select for Customer Group.
This config is already defined in the extension and given here only as an example.
<config>
    <eavTable name="customer_entity" label="Customers" group="Customers" type="customer">
        <pk name="entity_id" label="Customer ID"/>
        <fk name="default_billing" table="customer_address_entity"/>

        <column name="email" label="Email"/>
        <column name="group_id"
                label="Group"
                type="select"
                options="Mirasvit\Report\Config\Source\Customer\Group"/>
    </eavTable>
</config>
Example for Active Special Price column
This config creates a column that displays active product special prices for the current date. This config can help build the report that displays all products with active special prices.
<config>
<table name="catalog_product_entity">
<column name="active_special_price"
label="Active Special Price"
fields="special_price,special_from_date,special_to_date"
type="money"
expr="IF(DATE(IFNULL(%2, 0)) < DATE(NOW()) AND DATE(IFNULL(%3, NOW())) >= DATE(NOW()), IFNULL(%1, 0), 0)" />
</table>
</config>Config Builder
Predefined reports provided by the extension and Report Builder can cover most cases for analyzing sales in a simple Magento store. However, the real stores and types of items they sell may require more advanced and flexible tools to analyze different parts of their sales. Also, real stores can have a lot of 3rd-party extensions with their own database tables that contain important data for sales/marketing/inventory analytics.
The Config Builder is exactly the tool for such purposes. It is located in Reports -> Advanced Reports -> Config Builder.
The Config Builder provides the ability to create Synthetic columns with complex data calculation/aggregation and to adjust relations between the native Magento database tables and tables from a 3rd-party or custom extension so the data in reports will be as accurate as possible.
Config Builder Overview
Open either the Report Builder or Config Builder menu, and select the Add New Config action on the right menu section. You will be brought to the Config Workspace:
It is very simple and contains the following fields:
- Title - the new synthetic field's name (named whatever you wish).
- XML Config - column definition as XML document.
The Structure of the XML Config
config
This is the root element, e.g. all other tags should be contained inside it.
There are only 3 possible nodes allowed inside the config element - <table />, <eavTable />, <relation />.
table
This element must be used for registering tables so the extension will be able to retrieve data from them.
This element also can be used for already defined tables to assign custom synthetic columns to them.
Allowed child elements: <pk />, <fk />, <column />.
Attributes:
| Attribute | Description | Required | Default |
|---|---|---|---|
| name | name of the table. The name should be specified without the table prefix. This means that if you have in your database a prefix like mage_ and real table name mage_sales_order, you need to enter here just sales_order |
required | none |
| group | name of a group, under which this table appears in the Report Builder. Default values: Sales, Products, Customers, Categories, Other. |
optional | Other |
| label | the label of a table that is used in identifying a table. | optional | the value of the name attribute |
eavTable
This element must be used for registering EAV tables so the extension will be able to retrieve data from corresponding EAV entities including their attributes.
This element SHOULD NOT be used for native EAV tables like catalog_product_entity, catalog_category_entity, customer_entity, etc as these EAV entities are already registered in the extension.
Allowed child elements: <pk />, <fk />, <column />.
Attributes:
| Attribute | Description | Required | Default |
|---|---|---|---|
| name | name of the table. The name should be specified without the table prefix. This means that if you have in your database a prefix like mage_ and real table name mage_sales_order, you need to enter here just sales_order |
required | none |
| group | name of a group, under which this table appears in the Report Builder. Default values: Sales, Products, Customers, Categories, Other. |
optional | Other |
| label | the label of a table that is used in identifying a table. | optional | the value of the name attribute |
| type | the type code of the EAV entity. The code can be found in the entity_type_code column in the eav_entity_type table |
required | none |
pk
The primary key of the table. This element is optional and SHOULD NOT be used on native tables.
Attributes:
| Attribute | Description | Required | Default |
|---|---|---|---|
| name | the name of the primary key column | required | none |
| label | the labels for the column | optional | the value of the name attribute |
fk
The foreign key is in the table. This element is optional and SHOULD NOT be used on native tables.
Attributes:
| Attribute | Description | Required | Default |
|---|---|---|---|
| name | the name of the foreign key column | required | none |
| label | the labels for the column | optional | the value of the name attribute |
| table | the relation table name without prefix | required | none |
column
This element is responsible for defining the column. This element is mostly used for synthetic columns with custom calculations.
Attributes:
| Attribute | Description | Required | Default |
|---|---|---|---|
| name | the name of the primary key column | required | none |
| label | the labels for the column | optional | the value of the name attribute |
| type | data type of the column's value. The type defines how the value of the column will be displayed and possible aggregations for the column. The extension will automatically add columns with aggregations to the Column Chooser. Supported types: money, country, date, qty, number, select, percent, store, html. More information about data types you can check here |
optional | html |
| fields | comma-separated list of fields, which will be used in calculations | optional | if omitted the value from the name field will be used |
| expr | this attribute contains MySQL expression to calculate field value. You can use placeholders, where %1 corresponds to the first field in the previous attribute, %2 - to the second, and so on. |
optional | %1 |
| options | non-mandatory attribute where the data type select or country is used. Here you need to enter the full name or the class that implements the method toOptionArray for this column. |
optional | none |
| tables | comma-separated list of table names (without prefix) for the ability to include columns from other tables inside the expr field | optional | none |
| Type | Description | Aggregators |
|---|---|---|
| html | Simple string, Output values as it is | JOIN |
| number | Number rounded to 2 decimal points | SUM, AVG |
| qty | Integer value, mostly used for ID fields | COUNT |
| percent | Value formatted as a percentage with % symbol, rounded to 2 decimal points |
AVG |
| money | Currency format, displays numbers with currency symbol, rounded to 2 decimal points. If the report is filtered by one particular store the value will be displayed in the default currency for that store. Otherwise, the default store currency will be used | SUM, AVG |
| date | Date format, Depending on the aggregation type the output may vary | HOUR, DAY, DAY OF WEEK, MONTH, QUARTER, YEAR |
| select | The type for the field with predefined variations for values. With this type, the options attribute SHOULD be used in the column element |
JOIN |
| country | Similar to the select type. If the value of the column is in the ISO 3166-1 alpha-2 format then class Mirasvit\Report\Config\Source\Directory\Country can be used as the value of the options attribute in the column element |
JOIN |
| store | Similar to the select type but store labels will be retrieved by the extension so the options attribute SHOULD NOT be used along with this data type |
none |
relation
The module should determine how to link different tables to build reports from multiple tables.
The connection between two or more tables is called a table relationship.
The < relation /> element is responsible for defining relations between tables.
Required child elements: <leftTable />, <rightTable />, <condition />.
Attributes:
| Attribute | Description | Required | Default |
|---|---|---|---|
| name | the name of the relation. the name can be any string but it is recommended to use the following format: leftTable-rightTable |
required | none |
| type | the type of the relation between tables. Possible values: 11 - one to one; 1n - one to many. |
required | none |
leftTable, rightTable
This element is responsible for defining tables in the relation in the next format: <leftTable>sales_order_item</leftTable>.
The table name should be specified without the table prefix. These elements don't have attributes.
condition
This element is responsible for defining JOIN conditions between leftTable and rightTable using MySQL syntax.
You can use placeholders %1 and %2 where %1 is a placeholder for the letTable and %2 - for the rightTable
Config Examples
Simple Synthetic Field Config
A synthetic field that calculates the Gross Profit on the fly based on the actual invoiced orders.
<config>
    <table name="sales_order" group="Sales" label="Orders">
        <column name="custom_gross_profit"
                label="Custom Gross Profit"
                fields="base_subtotal_invoiced,base_total_invoiced_cost,base_total_refunded,base_to_global_rate"
                type="money"
                expr="(%1 - IFNULL(%2, 0) - IFNULL(%3, 0)) * %4" />
    </table>
</config>
Multi-table Synthetic Field
A synthetic field that calculates the Total (row total) for items in the cart.
This config is a part of the already defined config for the table qoute_item and is given here only as an example.
<config>
    <table name="quote_item" label="Quote Items" group="Sales">
        <column name="row_total"
                label="Total"
                fields="base_row_total"
                type="money"
                expr="%1 * IF(quote.base_to_global_rate > 0, quote.base_to_global_rate, 1)"
                tables="quote"/>
    </table>
</config>
Simple Relation Config
The example of building a relationship between sales_order and sales_order_item tables.
<config>
    <relation name="sales_order-sales_order_item" type="1n">
        <leftTable>sales_order_item</leftTable>
        <rightTable>sales_order</rightTable>
        <condition>%2.entity_id=%1.order_id AND %1.parent_item_id IS NULL</condition>
    </relation>
</config>
Config for Shipment Date per Item
The config with relations and synthetic column to display the shipment date for each item in the order even if items from the order were shipped separately.
At first, the sales_shipment_item table needs to be registered in the extension.
Then necessary relations are adjusted to properly connect items in the cart with shipment tables. After the Shipment Date column is defined in the sales_shipment table (to give a self-explanatory label for the column, this part is optional).
<config>
    <table name="sales_shipment_item" group="Sales" label="Shipment Item">
        <pk name="entity_id"/>
        <column name="parent_id" label="Shipment Id"/>
        <column name="order_item_id" label="Order Item Id"/>
    </table>

    <relation name="sales_order_item-sales_shipment_item" type="11">
        <leftTable>sales_order_item</leftTable>
        <rightTable>sales_shipment_item</rightTable>
        <condition>%1.item_id=%2.order_item_id</condition>
    </relation>

    <relation name="sales_shipment-sales_shipment_item" type="11">
        <leftTable>sales_shipment</leftTable>
        <rightTable>sales_shipment_item</rightTable>
        <condition>%1.entity_id=%2.parent_id</condition>
    </relation>

    <table name="sales_shipment" group="Sales" label="Shipment">
        <column name="shipped_at" label="Shipment Date" fields="created_at" type="date"/>
    </table>
</config>
EavTable Config Example
This config defines the EAV entity table and automatically adds columns for all attributes related to this entity.
This example includes the primary key field, the foreign key to connect customer_entity table with customer_address_entity table (in this case, another EAV entity), and the column of the type select for Customer Group.
This config is already defined in the extension and given here only as an example.
<config>
    <eavTable name="customer_entity" label="Customers" group="Customers" type="customer">
        <pk name="entity_id" label="Customer ID"/>
        <fk name="default_billing" table="customer_address_entity"/>

        <column name="email" label="Email"/>
        <column name="group_id"
                label="Group"
                type="select"
                options="Mirasvit\Report\Config\Source\Customer\Group"/>
    </eavTable>
</config>
Example for Active Special Price column
This config creates a column that displays active product special prices for the current date. This config can help build the report that displays all products with active special prices.
<config>
<table name="catalog_product_entity">
<column name="active_special_price"
label="Active Special Price"
fields="special_price,special_from_date,special_to_date"
type="money"
expr="IF(DATE(IFNULL(%2, 0)) < DATE(NOW()) AND DATE(IFNULL(%3, NOW())) >= DATE(NOW()), IFNULL(%1, 0), 0)" />
</table>
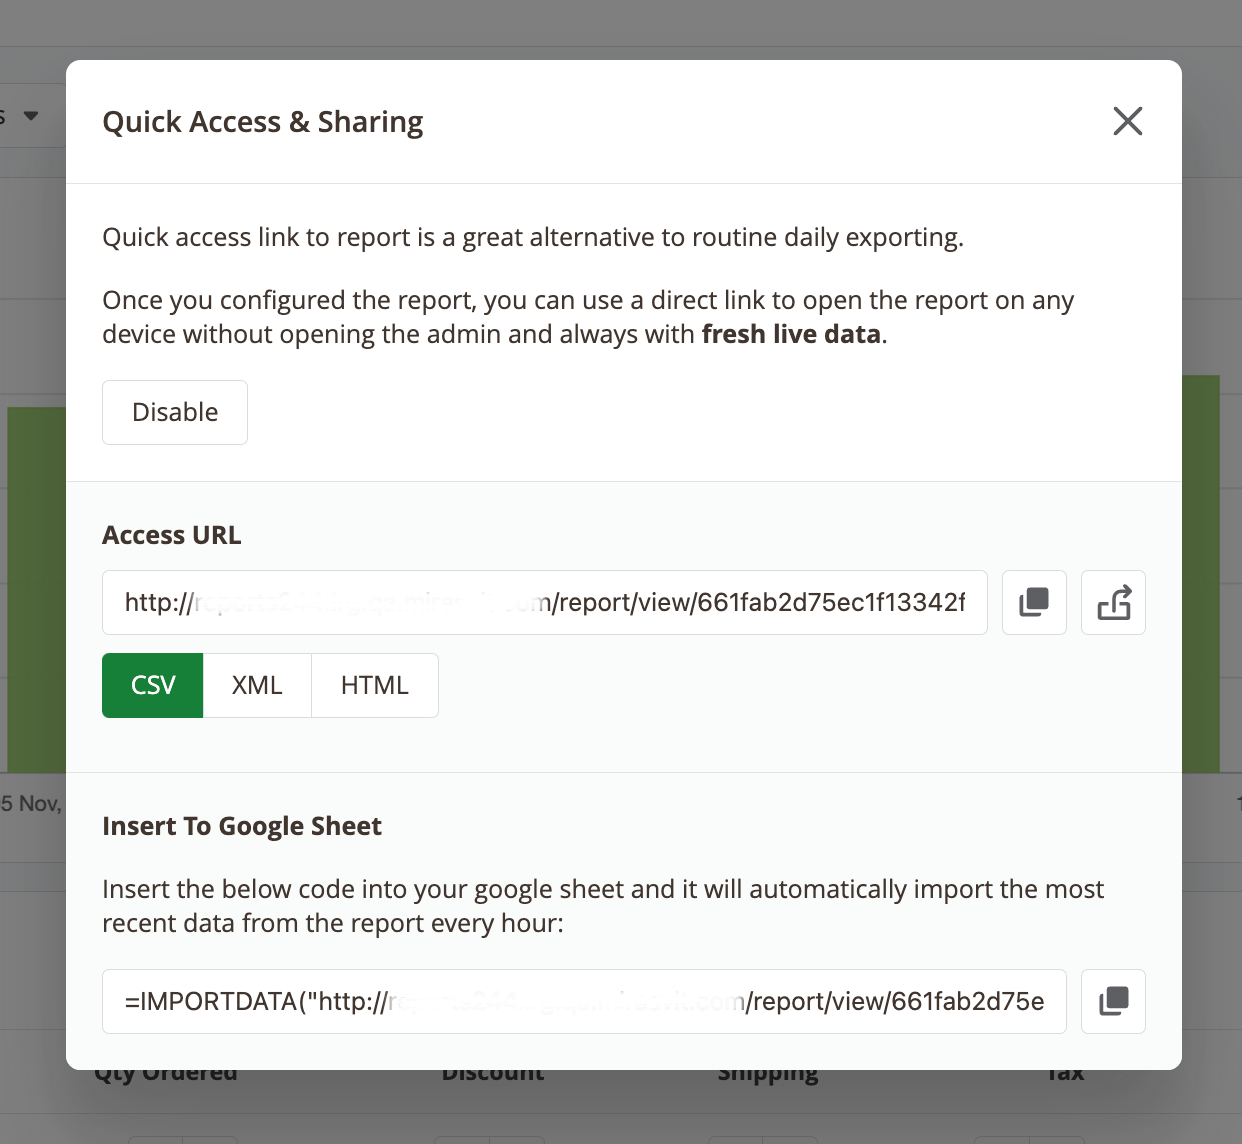
</config>Quick Access and Sharing
The Advanced Reports extension offers the convenience of accessing report data without the need to log into the admin panel.
Get real-time data that is always up-to-date, share valuable stock information with your vendors, or import report data into Google Sheets using the direct link. Whenever you visit the link, the extension will provide you with the most recent report data.
Once the report is configured, click the Share button to open the configuration popup for Quick Access and Sharing. Ensure that you have saved the report, as the extension generates reports, accessible by quick links, based on the stored report's settings (state).
Choose the desired report format and either copy the link or visit it using the appropriate buttons. Alternatively, you can copy and insert the ready-to-use code into Google Sheets.
If any adjustments need to be made to the report after sharing the direct link, simply modify and save it. The link to the report will remain the same, ensuring that anyone with access to the link will receive the updated report.
To prevent unexpected changes to reports, control who can edit and share reports by utilizing the User Permissions settings.
Access Restrictions
The Advanced Reports extension provides the ability to configure Access Restrictions for admin users using Magento ACL.
Access to each report created in the extension can be restricted separately, even for custom reports.
You can also define who will be able to edit and share reports as well as restrict access to Config Builder to avoid unexpected reports behavior due to changes in custom configs.
All that can be adjusted in System -> Permissions -> User Roles under the Role Resources tab.
Adding Blocks to the Dashboard
The Advanced Reports extension provides you with the ability to create custom dashboards to display almost any metrics from your store.
Create multiple dashboards with different widgets to quickly analyze your store activity like sales, customer activities, marketing efficiency, etc.
Create as many boards as you want and add as many widgets as you'd like to each board.
Dashboards can be private (only the user that created the board will be able to see it) or public (all admin users will be able to access them). You can also enable the quick access to dashboards so you can access them without logging into the admin panel of your store.
Interface
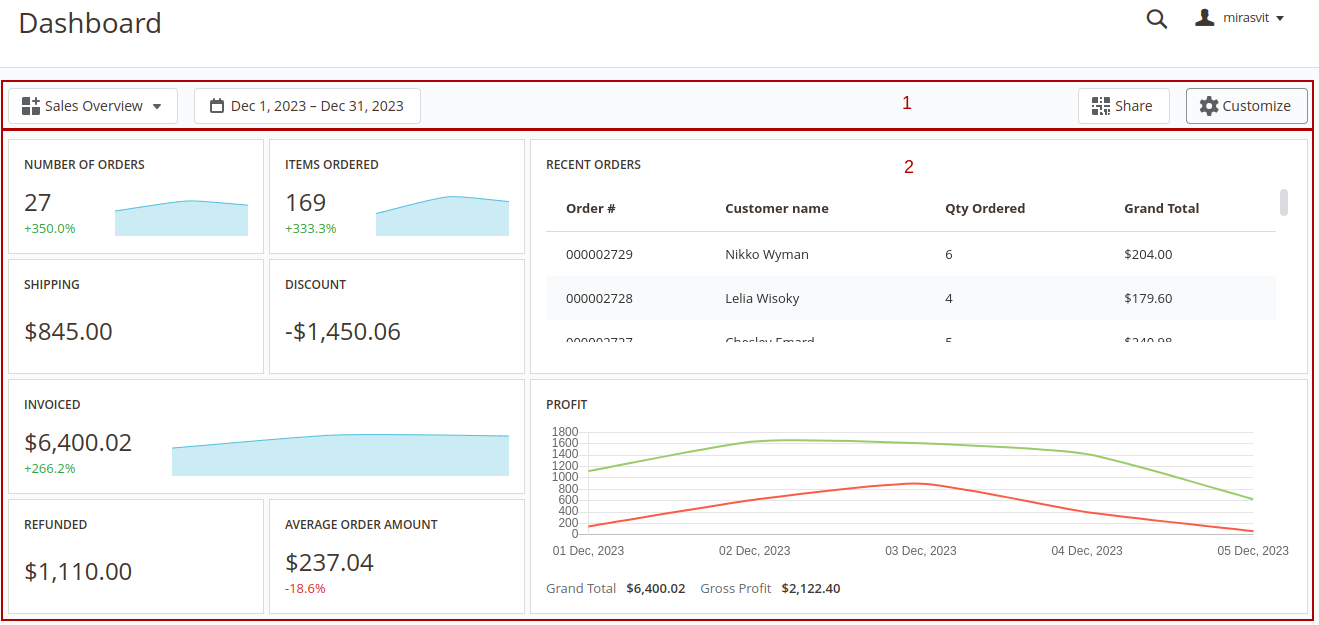
The interface of each dashboard contains 2 main sections: 1 Toolbar - the section where all control elements are placed. In the view mode the extension has the following control elements:
- Menu - navigation between boards
- Date Filter - select the date range that will be used for filtering data in the dashboard.
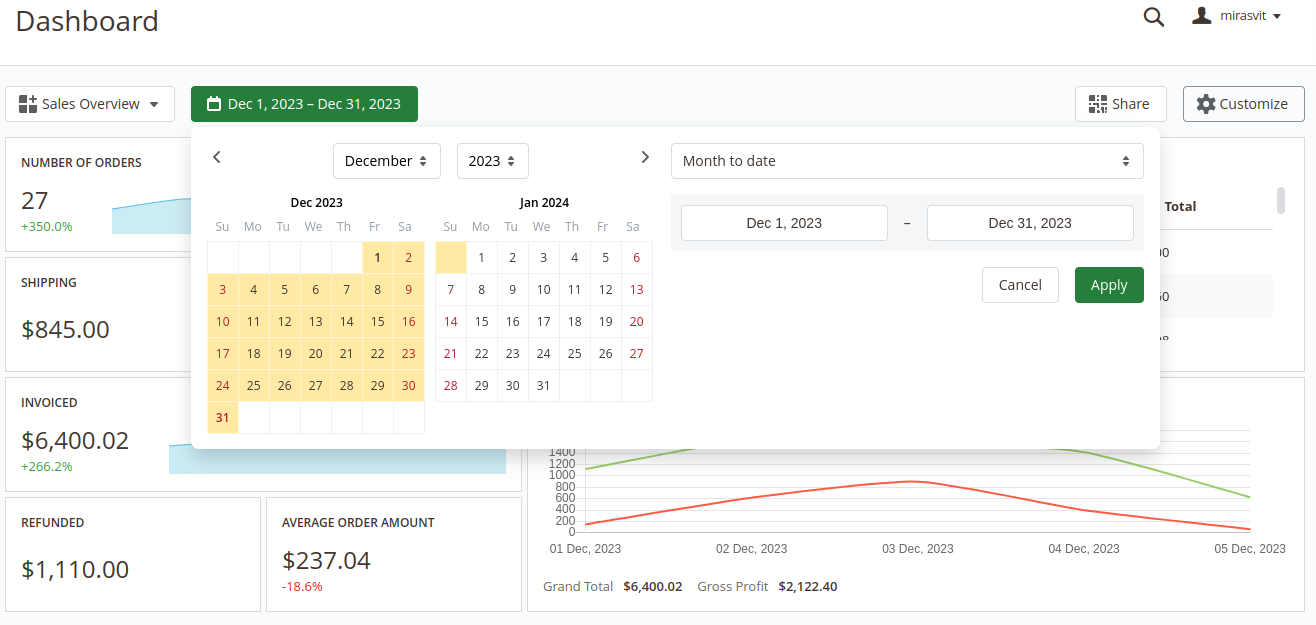 Widgets can have their own date ranges.
In this case, the Date Filter will not affect such widgets. More information about custom date ranges for widgets can be found here
Widgets can have their own date ranges.
In this case, the Date Filter will not affect such widgets. More information about custom date ranges for widgets can be found here - Share - enable/disable quick access to the current board
- Customize - switch board mode between View and Configure modes 2 Dashboard - the board where all widgets are displayed
Configuring Boards
To edit the current board or create a new one press the Customize button in the toolbar. The board will be switched to the Configure mode.
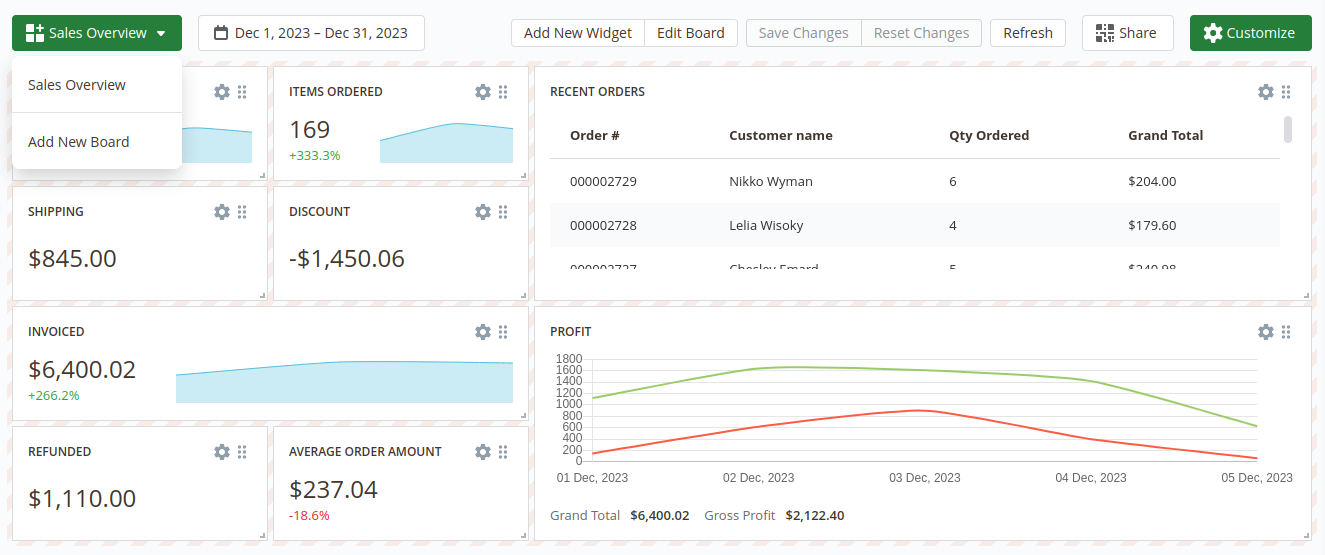
After switching the board to the Configure mode the additional control elements in the Toolbar will appear:
- Add New Widget - add widget to the current board
- Edit Board - change the general settings of the board
- Save Changes - save the dashboard after configuring it
- Reset Changes - reset the board to the previously saved version
- Refresh - refresh the data in the board
Also in the Configure mode each widget can be adjusted. More information about adjusting widgets is described in the Widgets Settings section
To create a new board open the Menu in the toolbar and click on the Add New Board option. After that, the popup will appear when you can set the main board information:
- Title - the name of the current board
- Type - defines the access scope for the current board - Private or Public
- Is Default - defines whether the current board should be displayed by default or not
These settings can be changed later by clicking the Edit Board button in the Toolbar.
After creating the board you can proceed with adding widgets to that board.
Configuring Widgets
To add a widget into the board press the Add New Widget button.
The extension will show a pop-up where you'll be able to choose one of the widgets from the extension's widgets library or create an empty widget and configure it from scratch.
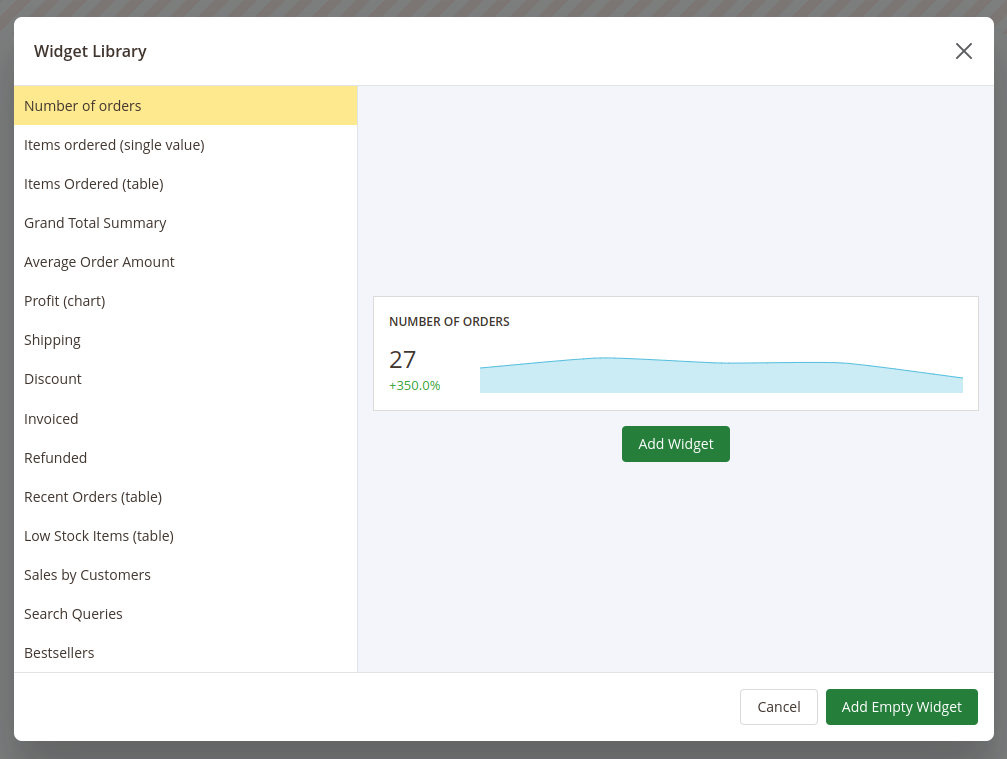
After adding a new widget you can adjust it even if the widget is added from the widgets library.
To change the place where the widget should be placed press on the icon in the right top corner of the widget, drag the widget and drop it in the place instead of the board field where you'd like for this widget to be placed in.
To adjust the size of the widget press on the bottom right corner of the widget and drag the cursor to change the size of the widget.
To configure the widget press the gear icon in the right top corner of the widget. The Widget Editor will appear.
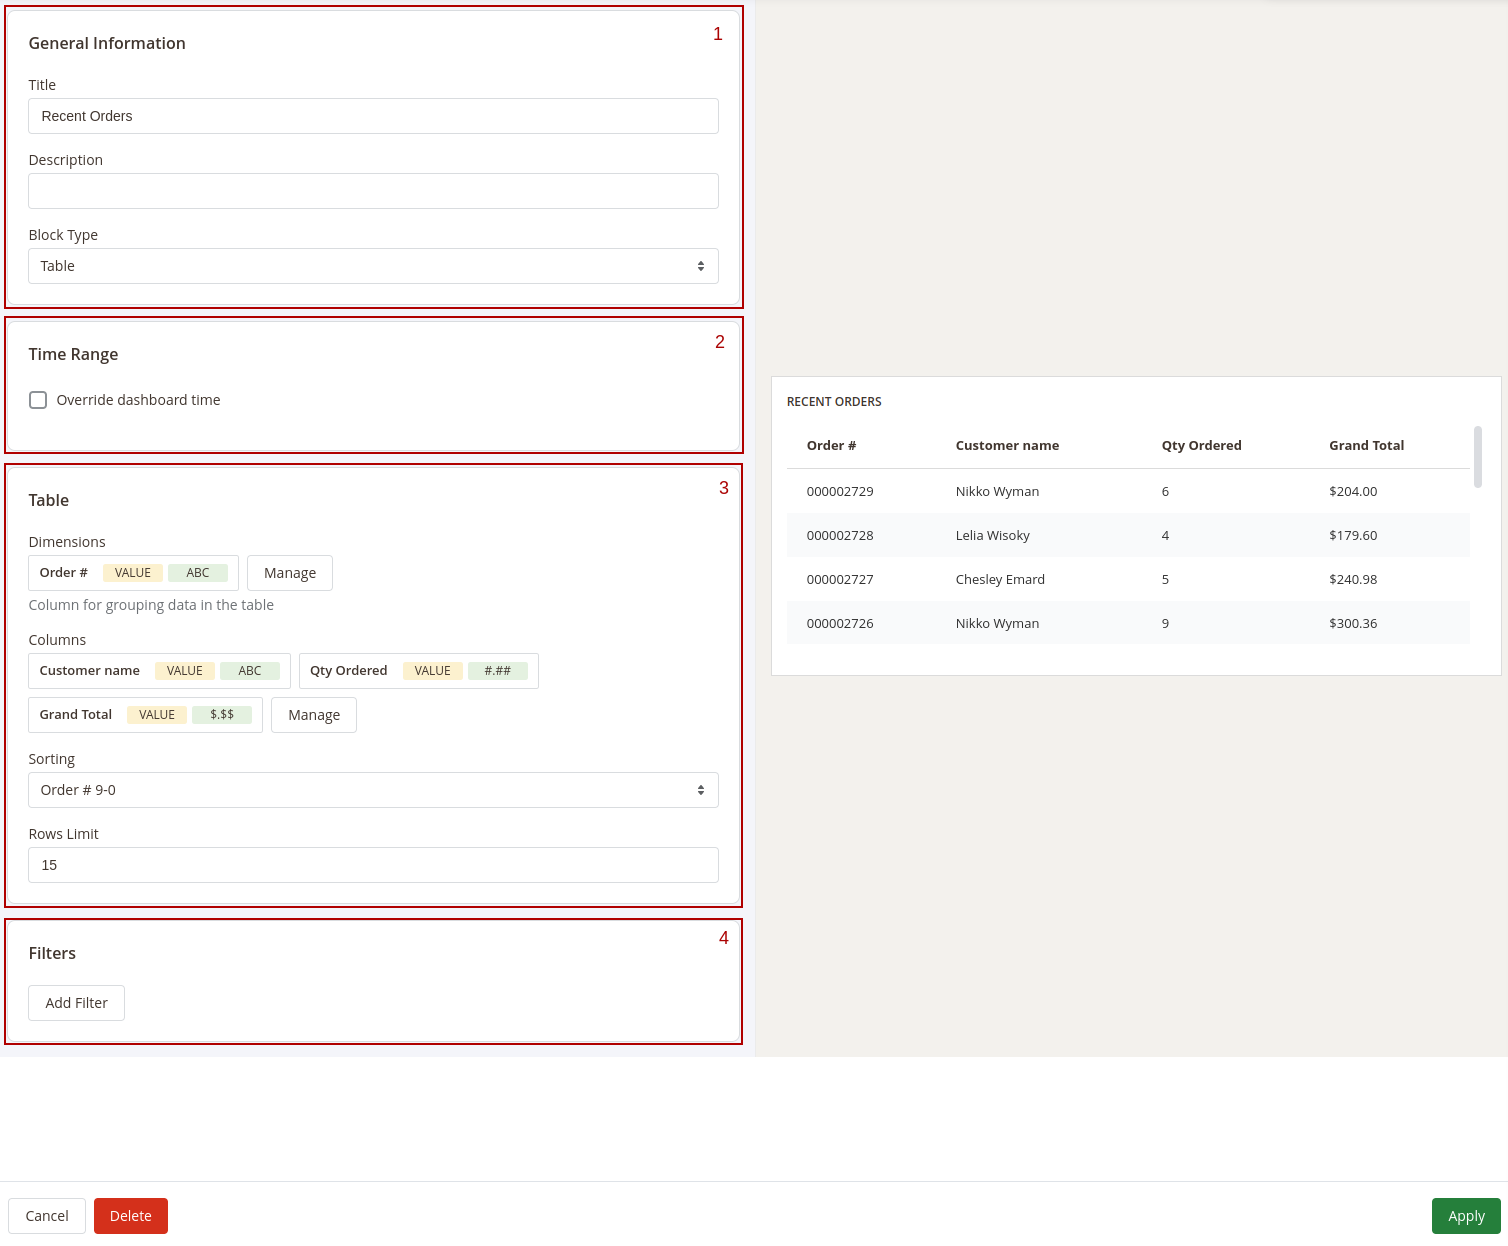
The Widget Editor has 2 sections - Widget Settings to configure the widget and Preview to check how the data in the widget will be displayed before saving the widget.
the Widget Settings section has the following inner sections:
- General - main configurations of the widget. This section has the following settings:
- Title - the name of the widget
- Description - widget's description
- Type - defines how the data in the widget should be displayed.
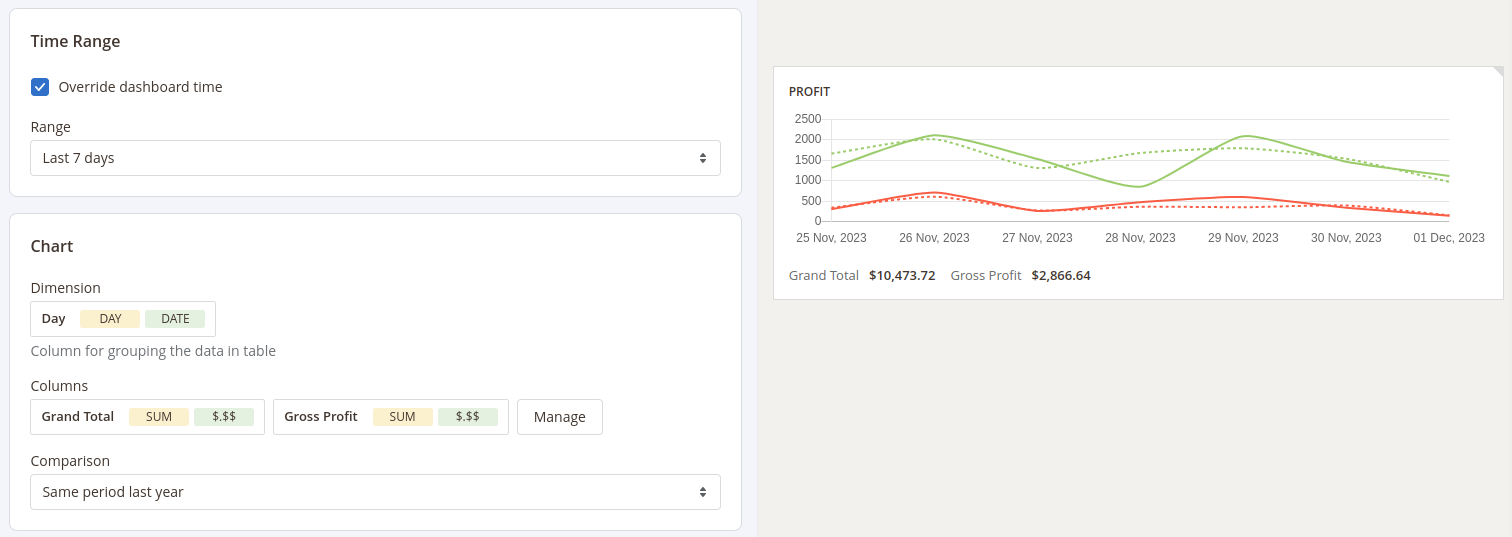
- Time Range - date filter settings for the widget. This section has only one setting - Override dashboard time. When this setting is enabled the widget will use its own date range to filter the data. You'll be able to choose one of predefined date ranges from the Range dropdown.
- Widget's content settings this section depends on the Type of the widget and has different setting options correspondingly:
- Single Value - shows the single value in the widget
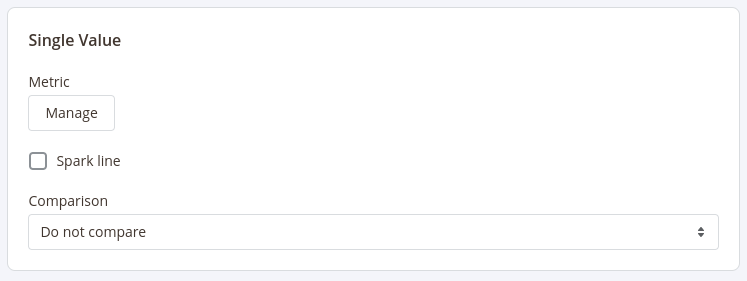 This type has 3 settings:
- Metric - choose the column for which the data in the widget should be displayed
- Spark Line - show/hide the sparkline representing changes of the value from the column selected in the Metric setting during the time range applicable for current widget
- Comparison - choose the period for which the widget should display the value for the same metric to compare it with the current value
- Table - displays the table with values according to the configurations (similar to how the reports are displayed)
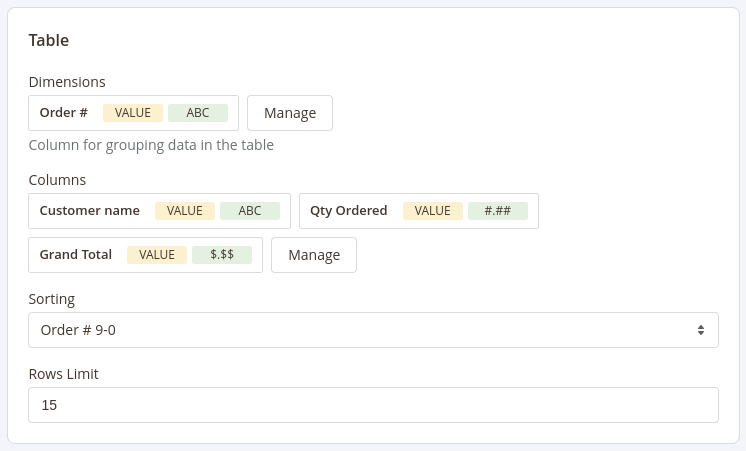 This type has 4 settings similar to settings in reports configurations:
- Dimensions - set the dimensions for the table
- Columns - select fields that should be displayed in the report
- Sorting - select the column for the report to be sorted by and the sorting direction. Options depend on the fields selected in the Dimensions and Columns settings
- Rows Limit - set the limit for the number of rows to be displayed in the table
- Chart - displays the data in the widget as a chart
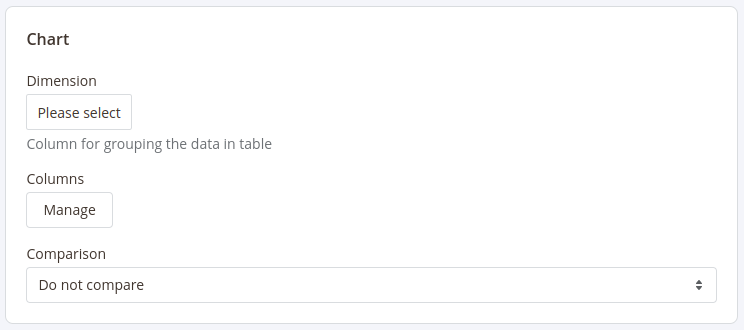 This type has 3 settings:
- Dimension - defines the horizontal axe in the chart
- Columns - defines the fields data that should be used in the chart
- Comparison - defines the period in which the current data in the chart should be compared
- Single Value - shows the single value in the widget
- Filters - configure fields and conditions by which the data in the widget should be filtered. Similar to the Filters settings in reports configurations
After configuring the widget press the Apply button to apply the widget settings' changes.
After adding and configuring all widgets to the board press the Save Board button in the Toolbar and click the Customize button to exit the Configure mode.
Sharing Boards
Get quick access to the board without necessity to log into the admin panel by enabling sharing the dashboard.
To enable sharing dashboard click the Share button in the toolbar. The pop-up will appear where you can enable sharing the dashboard.
After sharing for the dashboard is enabled the pop-up will show the quick access link and QR code by which you can access the current dashboard on any device.
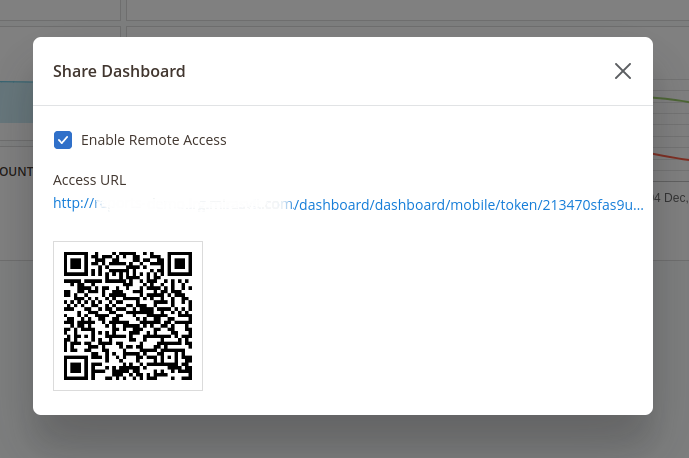
Share the link to the dashboard or QR code with your colleagues so they'll be able to access the dashboard and see all the metrics in it at any time.
Adding Blocks to the Dashboard
The Advanced Reports extension provides you with the ability to create custom dashboards to display almost any metrics from your store.
Create multiple dashboards with different widgets to quickly analyze your store activity like sales, customer activities, marketing efficiency, etc.
Create as many boards as you want and add as many widgets as you'd like to each board.
Dashboards can be private (only the user that created the board will be able to see it) or public (all admin users will be able to access them). You can also enable the quick access to dashboards so you can access them without logging into the admin panel of your store.
Interface
The interface of each dashboard contains 2 main sections: 1 Toolbar - the section where all control elements are placed. In the view mode the extension has the following control elements:
- Menu - navigation between boards
- Date Filter - select the date range that will be used for filtering data in the dashboard.
Widgets can have their own date ranges.
In this case, the Date Filter will not affect such widgets. More information about custom date ranges for widgets can be found here
- Share - enable/disable quick access to the current board
- Customize - switch board mode between View and Configure modes 2 Dashboard - the board where all widgets are displayed
Configuring Boards
To edit the current board or create a new one press the Customize button in the toolbar. The board will be switched to the Configure mode.
After switching the board to the Configure mode the additional control elements in the Toolbar will appear:
- Add New Widget - add widget to the current board
- Edit Board - change the general settings of the board
- Save Changes - save the dashboard after configuring it
- Reset Changes - reset the board to the previously saved version
- Refresh - refresh the data in the board
Also in the Configure mode each widget can be adjusted. More information about adjusting widgets is described in the Widgets Settings section
To create a new board open the Menu in the toolbar and click on the Add New Board option. After that, the popup will appear when you can set the main board information:
- Title - the name of the current board
- Type - defines the access scope for the current board - Private or Public
- Is Default - defines whether the current board should be displayed by default or not
These settings can be changed later by clicking the Edit Board button in the Toolbar.
After creating the board you can proceed with adding widgets to that board.
Configuring Widgets
To add a widget into the board press the Add New Widget button.
The extension will show a pop-up where you'll be able to choose one of the widgets from the extension's widgets library or create an empty widget and configure it from scratch.
After adding a new widget you can adjust it even if the widget is added from the widgets library.
To change the place where the widget should be placed press on the icon in the right top corner of the widget, drag the widget and drop it in the place instead of the board field where you'd like for this widget to be placed in.
To adjust the size of the widget press on the bottom right corner of the widget and drag the cursor to change the size of the widget.
To configure the widget press the gear icon in the right top corner of the widget. The Widget Editor will appear.
The Widget Editor has 2 sections - Widget Settings to configure the widget and Preview to check how the data in the widget will be displayed before saving the widget.
the Widget Settings section has the following inner sections:
- General - main configurations of the widget. This section has the following settings:
- Title - the name of the widget
- Description - widget's description
- Type - defines how the data in the widget should be displayed.
- Time Range - date filter settings for the widget. This section has only one setting - Override dashboard time. When this setting is enabled the widget will use its own date range to filter the data. You'll be able to choose one of predefined date ranges from the Range dropdown.
- Widget's content settings this section depends on the Type of the widget and has different setting options correspondingly:
- Single Value - shows the single value in the widget
This type has 3 settings:
- Metric - choose the column for which the data in the widget should be displayed
- Spark Line - show/hide the sparkline representing changes of the value from the column selected in the Metric setting during the time range applicable for current widget
- Comparison - choose the period for which the widget should display the value for the same metric to compare it with the current value
- Table - displays the table with values according to the configurations (similar to how the reports are displayed)
This type has 4 settings similar to settings in reports configurations:
- Dimensions - set the dimensions for the table
- Columns - select fields that should be displayed in the report
- Sorting - select the column for the report to be sorted by and the sorting direction. Options depend on the fields selected in the Dimensions and Columns settings
- Rows Limit - set the limit for the number of rows to be displayed in the table
- Chart - displays the data in the widget as a chart
This type has 3 settings:
- Dimension - defines the horizontal axe in the chart
- Columns - defines the fields data that should be used in the chart
- Comparison - defines the period in which the current data in the chart should be compared
- Single Value - shows the single value in the widget
- Filters - configure fields and conditions by which the data in the widget should be filtered. Similar to the Filters settings in reports configurations
After configuring the widget press the Apply button to apply the widget settings' changes.
After adding and configuring all widgets to the board press the Save Board button in the Toolbar and click the Customize button to exit the Configure mode.
Sharing Boards
Get quick access to the board without necessity to log into the admin panel by enabling sharing the dashboard.
To enable sharing dashboard click the Share button in the toolbar. The pop-up will appear where you can enable sharing the dashboard.
After sharing for the dashboard is enabled the pop-up will show the quick access link and QR code by which you can access the current dashboard on any device.
Share the link to the dashboard or QR code with your colleagues so they'll be able to access the dashboard and see all the metrics in it at any time.
Email Notifications
Our Advanced Reports extension allows you to create rich reports and send them via email as annual documents.
You can create such an email-based report from Reports -> Advanced Reports -> Email Notifications.
How to Create Email Notification
Jump to Reports -> Advanced Reports -> Email Notifications and press theAdd New Email button.
You will be led to the Email Report creation page, which is divided into two subsections:
General information contains basic information about the sending of Email Report:
- Title - an internal title of an Email Report.
- Status - whether the Email Notification is active and should be sent.
- Subject - a topic for the email, which encloses your Reports.
- Recipient - comma-separated emails of persons who should receive these Reports.
-
Schedule - text-based schedule for sending messages. It uses converted Cron notation.
A useful manual on it can be found here.
Example
Send Email Report at 23:59 every day:Enter Text:
23:59 every dayThe real schedule is behind it:
59 23 * * *
Body contains one or more rows, each containing a block with extracted and processed data about your store's work.
Each row has the following parameters:
- Block - this is the name given to the Report or Dashboard block which contains data collection.
- Date Interval - you can use this field to override the default block data range and force the collection of data for a certain period. Leave empty if you need to insert a report or a block.
- Rows limit - limits records that are processed while collecting data. It is used primarily to resolve performance issues (for example, having too much data to process at once can make emails get stuck while sending). Leave this section empty to process all data
The body can contain any number of Reports or Dashboard blocks. Therefore, you can automate your reports in a single email.
Command Line Interface
Usage: php -f bin/magento [options]
-
mirasvit:report:export [options]- export report.
The extension will generate a file with the report under the[root_store_path]/var/exportfolder.
The name of the file with the report will have the following format:report_[identifier]_[interval]_[export-date]_[export-time].[type].-
Main options:
--identifier order_plain- export report with the identifierorder_plain. This option is required.--type csv- export the report as a CSV file. The allowed file types are - csv, xml. This option is required.-
--interval last30Days- export the report for the last 30 days. This parameter is optional. If omitted, the lifetime report will be generated. With thecustominterval code, you can specify the custom interval for a report using additional options:--from- start date of the report. If omitted, the extension will use the earliest date.--to- end date of the report. If omitted, the extension will use current date.
Values for both options should be in the next format -
YYYY-MM-dd(for example, 2020-02-10). If both options are omitted, the lifetime report will be generated.
- Additional (informational) options:
--report-list- the list of all available reports (identifier - report name).--interval-list- the list of all available date intervals (code - description).
-
Troubleshoot
This section describes the most common problems that customers report and how they can be resolved:
- I do not want the Advanced Dashboard to be the default startup page
- No valid keys error
- How can I translate columns' labels
- My state, province or other location is not highlighted on a map in the Sales by Geo-data report
I do not want the Advanced Dashboard to be the default startup page
After installing the module, the Advanced Dashboard page will become a default startup page at the admin panel area.
Solution:
You need to change the startup page in the admin panel settings.
For this, navigate to the Stores > Settings > Configuration > Advanced > Admin and change the startup page.
For more information, please refer to the official Magento documentation.
No valid keys error
The error No valid keys may appear in the logs or the cron_schedule table as a message for the job_code reports_postcode_update.
Our module, Mirasvit Reports, uses the Google Maps API to download detailed information about the postcodes specified in the orders, so as to make it possible to view the "Sales by Geo-data" report.
This process is executed once each hour and only by cron (in the background).
To access the Google Maps API, we provide keys with the extension. The keys have a daily quote, and once the quote has expired, our module shows this message. This ensures that it does not make an error, but simply reports that today's quote for the keys has expired and will be restored tomorrow.
So you can ignore this error.
How can I translate columns' labels?
The columns' titles are created dynamically, based on the name of the table's field in your database. To translate them, you need to use the column name:
"Orders","Orders"
Some of the names do not contain the "Total" or "Average" keywords, so you should translate them without "Total" or "Average" keywords (columns with aggregator sum and avg correspondingly).
To translate "Total" and "Average" keywords, you can use the following strings:
"Average %1", "Average %1"
"Total %1", "Total %1"
My state, province or other location is not highlighted on a map in the Sales by Geo-data report
In some cases, a row showing a particular country's state (province or other regional district) is displayed in a report grid. However, the corresponding part of the map is not highlighted.
Solution:
In its documentation, Google states that a region code should be written in uppercase ISO-3166-2 compliant format. For example, for Germany, to highlight the state, we can use either its Subdivision Name (Bayern) or a corresponding Code (DE-BY).
For states, our module uses the subdivision names. However, the practice shows that not all correctly formed subdivision names are always visible on a map. If that is true to you, you need to use the appropriate Code instead.
To change the subdivision name to code, you can use the Magento translation mechanism. You can place the string below to your theme's translation file (in admin panel):
"Bayern", "DE-BY"
Then clean the translation cache php bin/magento cache:clean translate and refresh it.
How to upgrade the extension
To upgrade the extension, take the following steps:
- Back up your store's database and web directory.
- Log in to your server's SSH console and navigate to the root directory of the Magento 2 store.
- Update the current extension with all its dependencies:
composer require mirasvit/module-reports:* --update-with-dependenciesNote
In some cases, the command above may not be applicable, or you might not be able to update just the current module, and need to upgrade all the Mirasvit modules in a bundle. In this case, the command above will be of no effect.
Instead, run thecomposer update mirasvit/*command. It will update all Mirasvit modules installed in your store.
-
Update the extension:
php -f bin/magento setup:upgrade -
Clean the cache
php -f bin/magento cache:clean - Deploy static view files
    rm -rf pub/static/*
    rm -rf var/view_preprocessed/*
    php -f bin/magento setup:static-content:deploy
Disabling Extension
Temporarily Disable
To temporarily disable the extension, please take the following steps:
- Log in to your server's SSH console and navigate to the root directory of the Magento 2 store.
- Disable the extension:
php -f bin/magento module:disable Mirasvit_Report Mirasvit_Reports Mirasvit_DashboardNote
Always be sure to check when the other Mirasvit modules can build reports. If you have such modules, please use this command:php -f bin/magento module:disable Mirasvit_Reports Mirasvit_Dashboard - Log in to the Magento backend and refresh the store's cache (if enabled).
Extension Removal
To uninstall the extension, please take the following steps:
- Log in to your server's SSH console and navigate to the root directory of the Magento 2 store.
- Remove the extension:
composer remove mirasvit/module-reports - Log in to the Magento backend and refresh the store's cache (if enabled).
1.8.9
(2026-04-28)
Improvements
- REST API now validates the
timeRangeparameter against the list of supported presets and returns a clear error for unknown values, instead of silently falling back to a "today only" filter and returning empty data.
1.8.8
(2026-04-23)
Fixed
- Restored compatibility with PHP 7.3
1.8.7
(2026-04-21)
Improvements
- Added i18n support for 15 core locales (ar_SA, cs_CZ, de_DE, es_ES, fr_FR, it_IT, ja_JP, nl_NL, pl_PL, pt_BR, pt_PT, sv_SE, tr_TR, uk_UA, zh_Hans_CN)
1.8.6
(2026-04-20)
Fixed
- Fixed additional filters on aggregated date columns (such as minimum or maximum date) behaving incorrectly — "days ago" numeric filters are now applied only to raw date columns, not to aggregated values
1.8.5
(2026-03-19)
Improvements
- Improved compatibility with navigation in the CoPilot module
1.8.4
(2026-03-18)
Features
- Added AI CoPilot agent documentation for reports, enabling AI-assisted report navigation and analysis
1.8.3
(2026-03-11)
Fixed
- Fixed compatibility with Magento 2.4.9 (console commands)
1.8.2
(2026-03-04)
Features
- Shared reports management page — new admin listing shows all shared reports with the ability to enable or disable sharing for each report individually
- New ACL resource for managing shared reports
1.8.1
(2026-03-03)
Fixed
- Fixed internal filters being ignored when running reports via REST API
1.8.0
(2026-02-26)
Features
- REST API for reports — list, configure, and execute any report via REST API with full support for filters, pagination, sorting, and date ranges
- Compatibility with AI Agent Connector (MCP) and AI CoPilot modules
- Download dropdown in the report toolbar for quick access to shared report formats (CSV, XML, JSON, HTML)
Fixed
- Fixed product images not displaying in shared reports
- Fixed duplicate dashboard boards being created when admin secret key is enabled
1.7.6
(2025-12-10)
Fixed
- Fixed incorrect currency conversion for money-type columns (Grand Total by new/returning customers, Grand Total excl. Tax, Gross Profit) when filtered by a single store
- Added store-specific expressions to avoid double currency conversion in single-store reports
1.7.5
(2025-11-10)
Fixed
- Fixed reports not appearing in the menu and being inaccessible for admin users with limited ACL permissions — reports created by restricted users now get proper per-report ACL resources automatically
1.7.4
(2025-10-17)
Fixed
- Fixed error during
setup:upgraderelated to building ACL tree for reports
1.7.3
(2025-09-26)
Fixed
- Fixed the "Product Performance / Product" report not working after saving — the report detail view is now non-editable to prevent misconfiguration
- ⚠️ A data patch removes previously saved
catalog_product_detailreport configurations that could cause errors
1.7.2
(2025-06-26)
Features
- CTE support — option to use Common Table Expressions instead of temporary tables to prevent database locking issues on large datasets (requires MySQL 8.0+ or MariaDB 10.2+)
Improvements
- Reorganized module settings into General, Advanced, and Debugging sections with improved labels and descriptions
1.7.1
(2025-06-10)
Improvements
- Geo data import now works with remote storage (S3, etc.)
1.7.0
(2025-06-04)
Improvements
- WCAG 2.2 AA compliance for report UI elements (export links, form inputs)
Fixed
- Fixed Sales Overview report being accessible even when not allowed in admin role resources
- Fixed retrieving order items data from nullable columns for child products
1.6.6
(2025-05-13)
Fixed
- Fixed error on the Import/Export Reports settings page
1.6.5
(2025-05-05)
Features
- Import/Export report configurations — export custom report settings to JSON and import them on another store, with a new admin page under Reports settings
1.6.4
(2025-04-10)
Fixed
- Fixed compatibility with Magento 2.4.8 (postcode grid, cart overview, and product reports)
1.6.3
(2024-09-27)
Fixed
- Fixed incorrect Gross Margin and Gross Profit calculations — values now correctly handle NULL invoiced subtotals instead of producing negative amounts
- Fixed incorrect totals for columns using AVG aggregator
1.6.2
(2024-08-05)
Fixed
- Fixed incorrect tax amount in the Sales by Tax Rates report when multiple taxes are applied to the same order
1.6.1
(2024-07-29)
Improvements
- Added option to disable number formatting for numeric columns in CSV exports (outputs raw data instead)
1.6.0
(2024-06-12)
Improvements
- Added option to enable/disable logging of report requests to
system.logfor debugging
1.5.9
(2024-05-29)
Improvements
- Added toolbar filters (date range, store, order status) to the Product Performance detail view reports
1.5.8
(2024-04-09)
Fixed
- Fixed incorrect data for child products (configurable/bundle) in the Product Performance report
1.5.7
(2024-03-01)
Features
- Product Image column — display product thumbnail images directly in report grids
1.5.6
(2024-01-08)
Features
- New dashboard widget type: HTML — embed custom HTML content in dashboard boards
1.5.5
(2023-12-04)
Improvements
- Added option to group report data by dimension columns to avoid displaying duplicated rows in multidimensional reports
1.5.4
(2023-11-27)
Features
- Sharing and Quick Access for reports — share reports via link and access them quickly from the toolbar
1.5.3
(2023-09-28)
Fixed
- Fixed ACL permissions not working correctly for reports on Magento 2.4.5 and newer
1.5.2
(2023-07-12)
Fixed
- Fixed child products of bundle products (with static pricing) incorrectly displaying the parent product's price and total values in reports
1.5.1
(2023-02-10)
Improvements
- Improved postcode geo-data cron job performance
1.5.0
(2023-02-08)
Fixed
- Fixed error when running
bin/magento mirasvit:reports:cronon PHP 8.1
1.4.9
(2023-01-24)
Features
- Per-report ACL permissions — control access to individual reports in admin role settings, with dynamic ACL tree built from all available reports
Improvements
- Compatibility with Magento 2.4.6 (replaced deprecated
Zend_DateandZend_Jsonusage) - Updated Content Security Policy whitelist for Google Maps
1.4.8
(2022-12-28)
Fixed
- Fixed incorrect data in custom columns related to configurable products
1.4.7
(2022-11-24)
Fixed
- Fixed incorrect values in Product Performance report for configurable products and orders placed from the admin panel
1.4.6
(2022-09-02)
Fixed
- Fixed geo map chart not rendering in the Sales by Geo-data report (CSP whitelist update)
1.4.5
(2022-09-02)
Fixed
- Fixed the map not displaying in the Sales by Geo-data report
- Fixed console commands not returning proper exit codes
1.4.4
(2022-06-22)
Fixed
- Fixed PHP 8.1 compatibility in geo data helper
1.4.3
(2022-06-20)
Improvements
- ⚠️ Removed
db_schema_whitelist.json— no longer needed after switching to declarative schema
1.4.2
(2022-06-13)
Fixed
- Fixed the "Report by Cart Price Rules" report not loading correctly
1.4.1
(2022-05-10)
Improvements
- ⚠️ Switched to Magento declarative database schema (
db_schema.xml) — removed legacyInstallSchemaandUpgradeSchemaclasses
1.3.41
(2022-01-26)
Fixed
- PHP 8.1 compatibility fixes
1.3.40
(2021-01-23)
Improvements
- Comprehensive documentation update across all module docs
1.3.39
(2020-10-23)
Fixed
- Fixed merge conflict artifacts in configuration files
1.3.38
(2020-10-15)
Improvements
- Improved Order Overview and Order Plain report configurations
1.3.37
(2020-10-07)
Features
- Global filter by order status — filter all sales reports by order status from module settings
- Added column aggregators description to the report configuration UI
Improvements
- ⚠️ Renamed
Config.phptoConfigProvider.php— update any custom code referencingMirasvit\Reports\Model\Config
1.3.36
(2020-08-13)
Fixed
- Fixed compatibility with Magento 2.4.0
1.3.35
(2020-07-29)
Improvements
- Compatibility with Magento 2.4
1.3.34
(2020-05-28)
Improvements
- Reorganized admin menu structure to follow Magento development guidelines
1.3.33
(2020-04-06)
Fixed
- Fixed email notification attachments not working on Magento 2.2.7 and older
1.3.32
(2020-03-03)
Improvements
- Improved code quality with static analysis tooling across all source files
1.3.31
(2019-04-04)
Features
- GEO Chart — visualize sales data on an interactive geographic map
Improvements
- Improved geo postcode data processing
1.3.30
(2019-03-01)
Improvements
- ⚠️ Removed the Cart Product Detail report (
Cart/Product/Detail.php) - Cleaned up verbose output in postcode cron jobs
1.3.29
(2019-01-25)
Improvements
- Refactored sales order item data strategy for child products — improved how configurable/bundle product line items are resolved in reports
1.3.27
(2018-12-20)
Improvements
- ⚠️ Replaced email notification cron handler — removed
Cron/Email.phpin favor of an improved notification mechanism
1.3.25
(2018-11-29)
Features
- Major UI redesign — refreshed report interface with improved navigation and layout
Improvements
- Compatibility with Magento 2.3
- ⚠️ Removed debug block and template (
Block/Adminhtml/Debug.php,debug.phtml) - ⚠️ Renamed controller
Report.phptoAbstractReport.php
1.3.24
(2018-10-26)
Fixed
- Fixed "This report no longer exists" error after saving report settings
1.3.23
(2018-10-12)
Fixed
- Fixed Sales by Attribute report showing zero totals for some attributes
1.3.22
(2018-10-02)
Fixed
- Fixed Catalog Attribute report showing wrong values (regression since 1.3.21)
1.3.21
(2018-09-28)
Fixed
- Fixed Sales by Attribute report showing zero values for simple items grouped by configurable product attributes
- Removed "View Customer" action from Abandoned Carts report for guest (unregistered) customers
1.3.20
(2018-09-17)
Fixed
- Fixed Abandoned Products report not displaying data correctly
1.3.19
(2018-09-04)
Features
- Added Order Increment IDs column to the Product Performance detail report
- Added Order Payment Method columns to the Sales Overview report
Fixed
- Fixed display of unknown postcodes count in Magento Community Edition
- Fixed schema validation file path for
mst_report.xml
1.3.18
(2018-08-13)
Improvements
- Added order item columns to the Product Performance report
- Geo report now falls back to shipping address state when state data hasn't been downloaded
1.3.17
(2018-08-10)
Improvements
- Suppressed "No valid keys" error messages in logs
- Switched to free daily quota for resolving unknown postcodes (API keys no longer required)
1.3.16
(2018-08-03)
Improvements
- Added Order Item columns (SKU, Name, Qty) to Sales reports
1.3.15
(2018-07-27)
Fixed
- Fixed Product Performance detail report not filtering by the selected product
1.3.14
(2018-07-24)
Fixed
- Updated geocoding API endpoints for fetching geo data and resolving unknown postcodes
1.3.13
(2018-07-19)
Improvements
- Added customer group filter to the Product Performance report
Fixed
- Fixed email notification reports being sent multiple times
1.3.12
(2018-07-13)
Fixed
- Fixed New vs Returning Customers report — guest customers are now correctly treated as new customers
1.3.11
(2018-07-02)
Improvements
- Added order status filter to Sales by Category and Sales by Attribute reports
1.3.10
(2018-06-21)
Fixed
- Fixed incorrect "Total Cost" value in the Product Performance report
1.3.9
(2018-06-19)
Fixed
- Fixed Sales by Geo-data report not filtering by date
1.3.8
(2018-06-19)
Improvements
- Added ACL permissions for report settings page
1.3.7
(2018-06-06)
Improvements
- Added Payment Method filter to the Sales Overview report
1.3.6
(2018-06-04)
Fixed
- Fixed incorrect Total Cost calculation
- Fixed reports not filtering correctly by store view
- Fixed postcode resolution issues
1.3.5
(2018-04-25)
Improvements
- Added additional columns to Sales Overview and Sales by Attribute reports
1.3.4
(2018-04-17)
Fixed
- Fixed error when viewing the Abandoned Cart detail report
1.3.3
(2018-04-17)
Fixed
- Fixed compilation error caused by extra dependency
- Fixed compatibility with Magento 2.1
1.3.2
(2018-04-05)
Fixed
- Fixed Product Performance detail report not showing data for the selected product
1.3.1
(2018-02-16)
Features
- Report Builder — create custom reports with a visual builder, selecting tables, columns, filters, and relationships
1.3.0
(2018-02-09)
Features
- Geo Report — sales data visualization on a geographic map by country, region, and city
Fixed
- Fixed Sales by Customer report data
- Added "Manage Geo Data" menu item for postcode management
1.1.35
(2017-12-07)
Improvements
- Added filters by Customer Group, Order Status, and Day of Week to Sales by Attribute and Sales by Attribute Set reports
1.1.34
(2017-12-07)
Fixed
- Fixed filters on Customers > Products and Abandoned Carts > Abandoned Products columns
1.1.33
(2017-12-06)
Fixed
- Fixed filter by "Products" column
1.1.32
(2017-12-04)
Improvements
- Added "Product Total Margin" field to product reports
1.1.31
(2017-12-04)
Fixed
- Fixed API URLs for postcode geocoding service
1.1.30
(2017-11-13)
Features
- Customers report — new report showing customer activity, orders, and lifetime value
1.1.29
(2017-10-26)
Improvements
- Added Tax Title and Tax Percent columns to the Orders report
Fixed
- Fixed database connection for quote tables
1.1.28
(2017-10-24)
Features
- Sales by Attribute Set report — analyze sales grouped by product attribute sets
1.1.27
(2017-10-17)
Improvements
- Added "Gross Margin" column to the Product Performance report
1.1.25
(2017-10-17)
Improvements
- Added "Invoice ID" column to the Sales > Orders report
- Added "Grand Total excluding Tax" column to Sales reports
1.1.23
(2017-09-27)
Fixed
- Fixed compatibility with Magento 2.2
1.1.22
(2017-09-18)
Fixed
- Fixed cron error "undefined property" when executing the
reports_postcode_updatecron job - Fixed compatibility with Magento 2.2.0rc
1.1.21
(2017-08-22)
Improvements
- Added Transaction ID and Transaction Type columns to the Orders report
- Added Customer Group column to Abandoned Cart reports
Fixed
- Fixed incorrect quarter hints when building quarterly reports
- Fixed duplicate values in the "Qty Refunded" column
- Fixed incorrect "Out of Stock Estimate" calculation when product inventory quantity is negative
1.1.20
(2017-08-07)
Features
- Abandoned Products report — see which products are most frequently abandoned in carts
- Abandoned Products Detail report — drill down into abandonment data per product
Improvements
- Added chart visualization to the Product Performance Detail report
1.1.19
(2017-08-02)
Fixed
- Fixed accounting of "active" abandoned carts
1.1.17
(2017-08-02)
Features
- Abandoned Carts Overview report — summary of cart abandonment metrics
- Abandoned Carts report — detailed listing of abandoned carts with customer info and cart contents
Improvements
- Improved reports navigation menu layout
1.1.16
(2017-08-01)
Features
- Sales by Cart Price Rules report — track revenue impact of cart price rules and coupon codes
- Sales by Tax Rates report — analyze tax collection across different tax rates
Improvements
- Added ability to view sold products directly from the Sales Overview report
1.1.15
(2017-07-11)
Improvements
- Added "QTY Refunded" column to the Sales Overview report
1.1.14
(2017-07-11)
Improvements
- Added "Out of Stock Estimation Date" and "Stock Qty" columns to product reports
1.1.13
(2017-07-11)
Improvements
- New chart types for report visualizations
1.1.12
(2017-06-27)
Improvements
- Updated Google geocoding integration method
1.1.10
(2017-06-15)
Fixed
- Fixed default filter not applying correctly in Sales by Attribute and Sales by Category reports
1.1.9
(2017-06-08)
Fixed
- Fixed Day of Week column not displaying correctly
1.1.8
(2017-06-07)
Improvements
- Removed global limitation by order status — reports now show all order statuses by default
1.1.7
(2017-05-31)
Fixed
- Fixed data duplication in the Product Performance report
1.1.6
(2017-05-30)
Features
- Added search and filter controls to the Manage Geo Data admin grid
1.1.5
(2017-05-30)
Fixed
- Fixed geo data UI component redeclaration issue
1.1.4
(2017-05-29)
Features
- Added ability to delete geo data records from the admin panel
Fixed
- Fixed duplicate geo data entries when fetching data in different languages
1.1.2
(2017-05-17)
Fixed
- Fixed Email Notification ACL permissions
1.1.1
(2017-05-04)
Fixed
- Fixed Gross Profit calculation when product cost is not defined
- Fixed email notification cron job failures
1.1.0
(2017-02-20)
Fixed
- Fixed date handling in email notifications
1.0.19
(2017-01-09)
Features
- Added ability to filter all reports by order status
- Geo data support — initial geo-based reporting with postcode resolution
1.0.18.1
(2016-12-23)
Fixed
- Fixed cron job execution error
1.0.18
(2016-12-22)
Improvements
- Improved geo-data fetching logic and reliability
1.0.17
(2016-12-15)
Features
- Geo reports foundation — base geographic reporting infrastructure with postcode data
Fixed
- Fixed incorrect date range filtering
1.0.14
(2016-07-28)
Fixed
- Fixed error in the Product Performance Detail report
1.0.13
(2016-07-27)
Fixed
- Fixed incorrect product cost calculations in reports
1.0.12
(2016-07-01)
Fixed
- Fixed XML configuration conflict with module-support (renamed
report.xmltomreport.xml)
1.0.11
(2016-06-24)
Fixed
- Fixed compatibility with Magento 2.1
1.0.9
(2016-05-31)
Fixed
- Fixed reports ignoring order status filter and showing all orders regardless of status
- Fixed incorrect module dependency requirements
1.0.8
(2016-05-27)
Features
- Added ability to filter all reports by store view
1.0.7
(2016-05-25)
Fixed
- Fixed admin permissions issue preventing access to reports
1.0.6
(2016-05-19)
Improvements
- Added "Products" column to the Orders report
1.0.5
(2016-04-11)
Fixed
- Fixed admin menu navigation issue
- Fixed report filter application
- Fixed data filtration
1.0.4
(2016-02-29)
Fixed
- Fixed RequireJS declaration error
- Fixed percentage calculation in reports
- Fixed filter application issues
- Fixed dependency injection compilation error
1.0.3
(2016-02-02)
Improvements
- Updated core module dependency to version 1.2