Reports
Customer Segmentation Suite comes with one basic Report, available at Customers -> Customer segment -> Reports.
At the top of the page, there are statistical charts that display sales per segment. Using the switches at the top, you can select the date range, data granularity , as well as the chart appearance (chart, diagram, lines, columns).
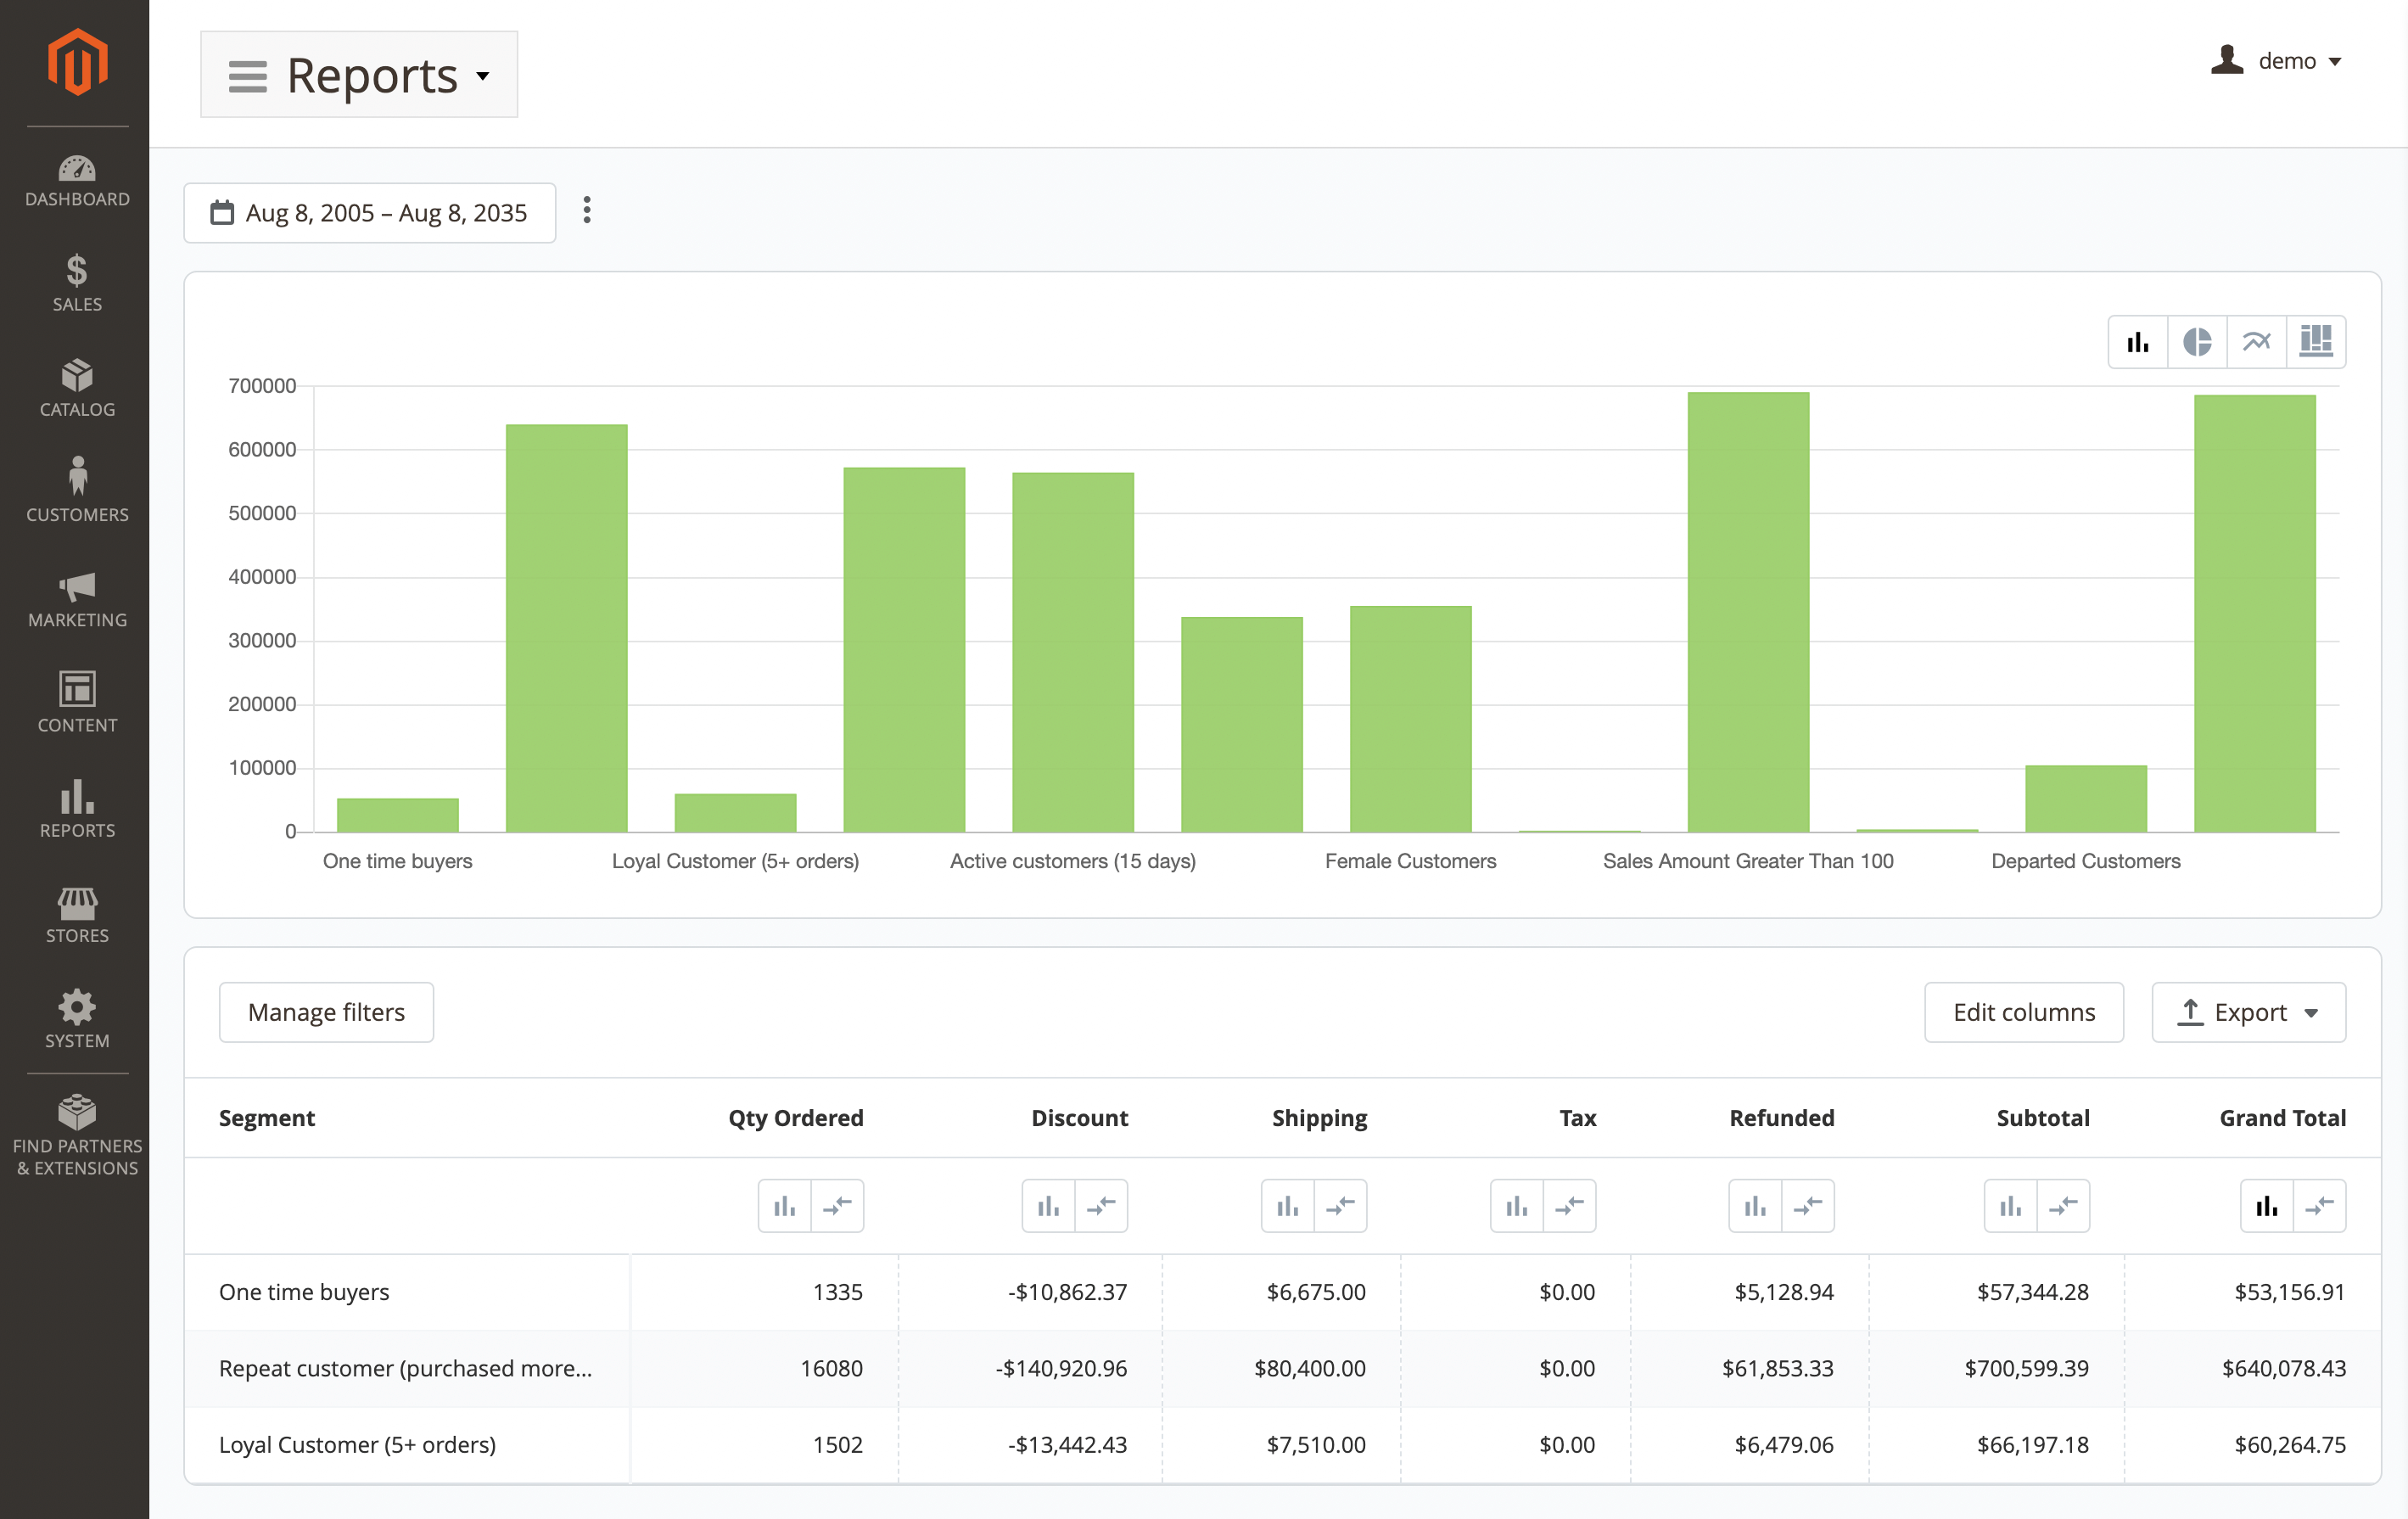
If necessary, you can apply filters, edit columns, and export the data to an XML or CSV file. By default, the following data is available:
- Segment: sensical name of segment.
- Qty Ordered: the number of orders, placed by customers, belonged to a particular segment (also displayed both in percent and absolute value).
- Discount: the amount of discount, provided in orders. Useful for tracking rewarding and discounting programs' efficiency.
- Shipping: the amount of shipping fees, paid in orders. Useful in an analysis of shipping methods.
- Tax: the amount of tax, paid in orders.
- Refunded: refund amount for particular segment, provided for orders.
- Subtotal: subtotals in orders.
- Grand Total: actually paid money amount in orders.
All these columns are also available as filters, which can be accessed with the Filters button and can be used for building flexible reports.
Data currently displayed in this statistics table also can be exported to both CSV and Excel formats. For that, you need to use the Export button, located near the Filters button.