How to use frontend debug panel
The debug panel lets you monitor and verify data collection in real time, so you can confirm the correct events and data are being tracked. The debug toolbar is shared by all Mirasvit tracking extensions (Facebook Pixel, Google Tag Manager, TikTok Pixel, Mixpanel, …).
Enable Debug mode
Set Debug mode to Yes under Stores → Settings → Configuration → Mirasvit Extensions → Marketing Tracking → Advanced. This setting is shared by all Mirasvit tracking extensions.
On-page debug toolbar
With Debug mode on, open any storefront page and append one of these query parameters to the URL:
?debug=fb- show only Facebook Pixel events?debug=tm- show events for all tracking extensions on the page
For example: https://yourstore.com/product-page?debug=fb
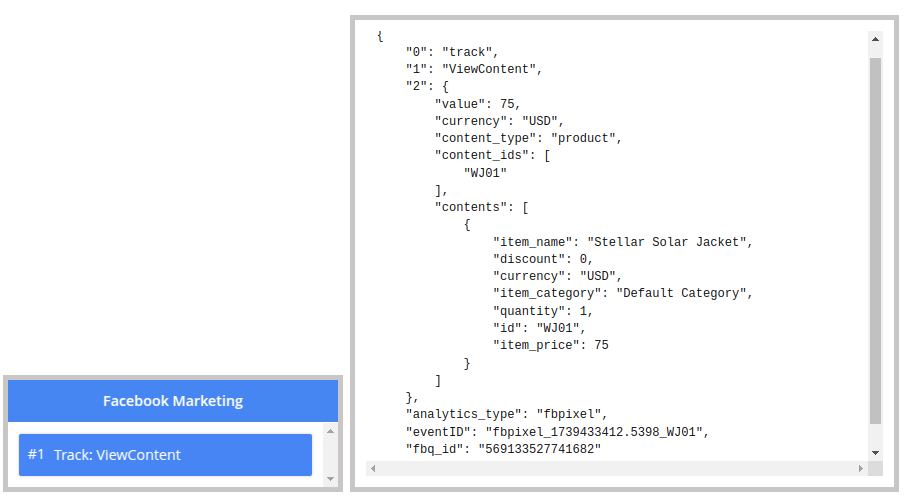
The toolbar appears at the bottom of the screen and lists every event as it fires, along with the data collected. Click an event to inspect its full payload and confirm the data sent to the Pixel and the Conversions API.
If you run several Mirasvit tracking extensions, you can focus any one of them with ?debug=fb,
?debug=gtm, ?debug=mixpanel, or ?debug=tiktok, or see them all together with ?debug=tm.
Server-side log
With Debug mode enabled, server-side activity (including Conversions API requests) is traced to
var/log/mirasvit_tm.log.