Efficiency report
Extension provide a simple efficiency reports for Built-in mode. To check it navigate to System > Page Cache Warmer > Efficiency Report
At the top of the page, there are statistical charts that display the performance of the extension and the Magento cache system. Using the switches at the top, you can select the date range, data granularity , as well as the chart appearance (chart, diagram, lines, columns).
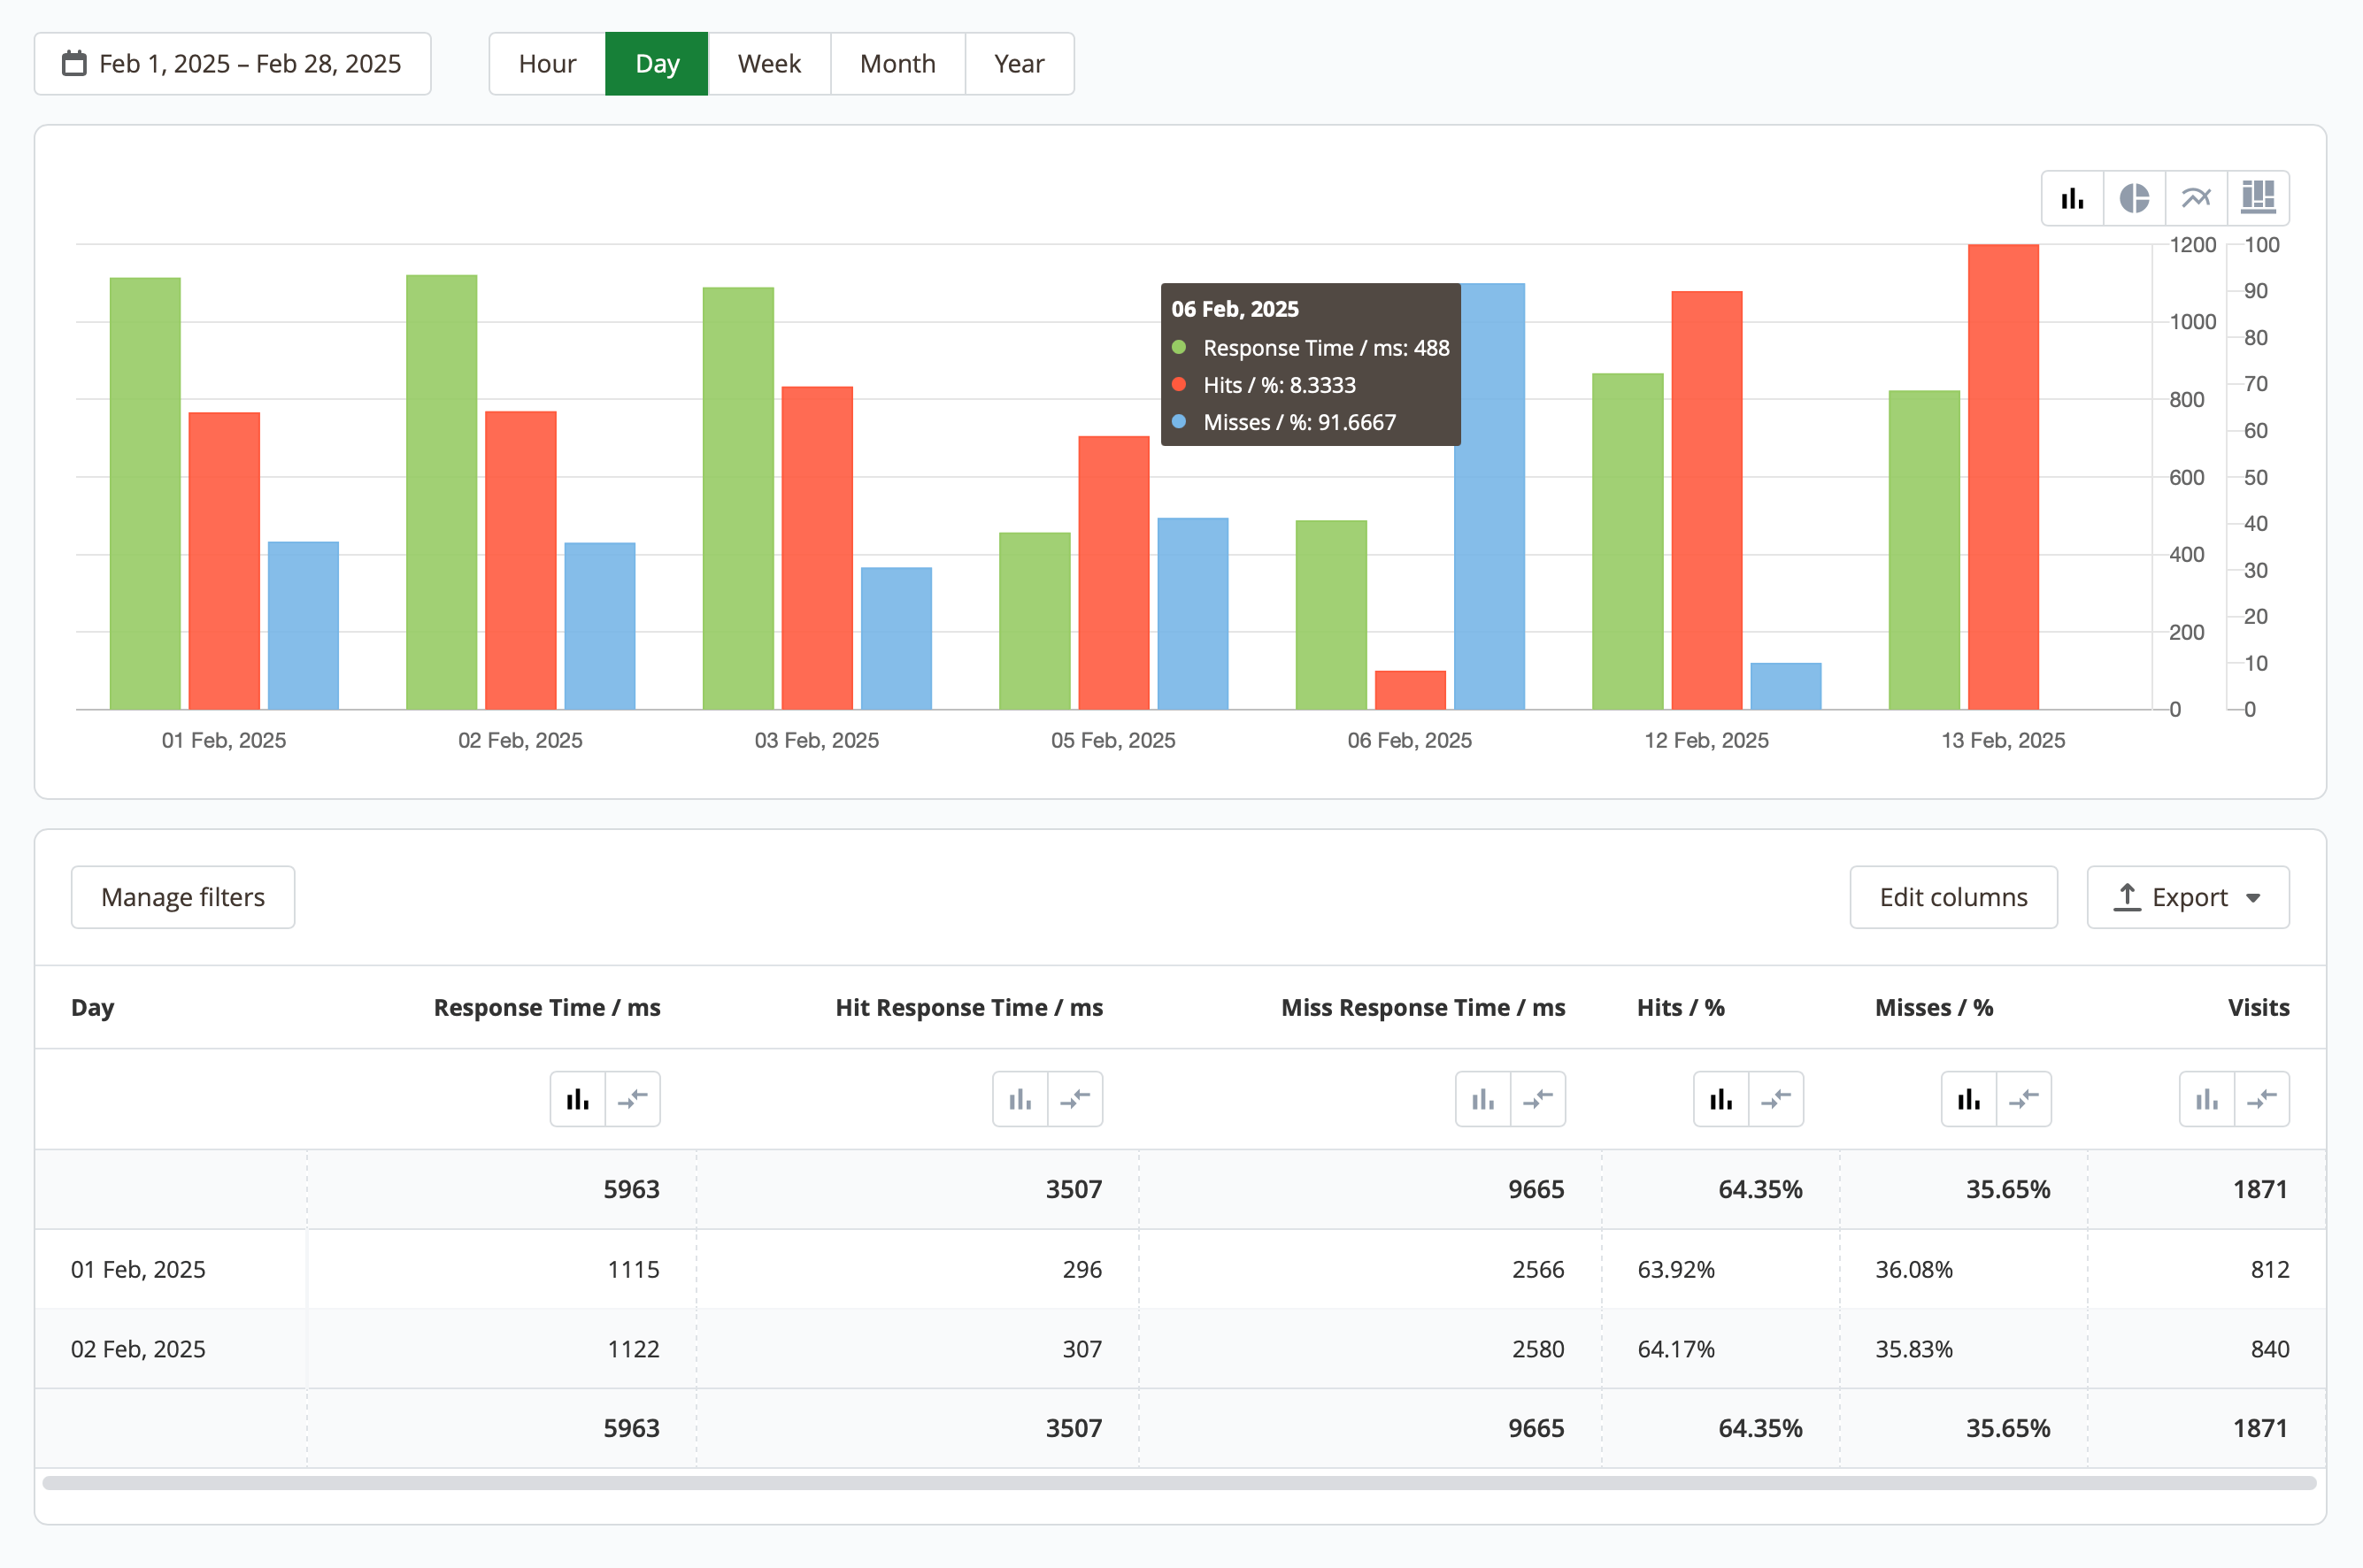
If necessary, you can apply filters, edit columns, and export the data to an XML or CSV file. By default, the following data is available:
- Time: shows the selected date range (hour, day, week, month, year).
- Response time / ms: average server response time.
- Hit response time / ms: average response time for warmed-up (cached) pages.
- Miss response time / ms: average response time for uncached pages.
- Hits / %: the percentage of successfully warmed-up pages that were opened by customers.
- Misses / %: the percentage of uncached pages that were opened by customers.
- Visits: total number of visits.