Jobs section
Used to check the job queue, get reports on the launch of each cron task and other technical information. To work with it, navigate to System -> Page Cache Warmer -> Jobs.
Statistical info block
At the top of the page there are statistical charts that display the Average system load and Cache fill history data.
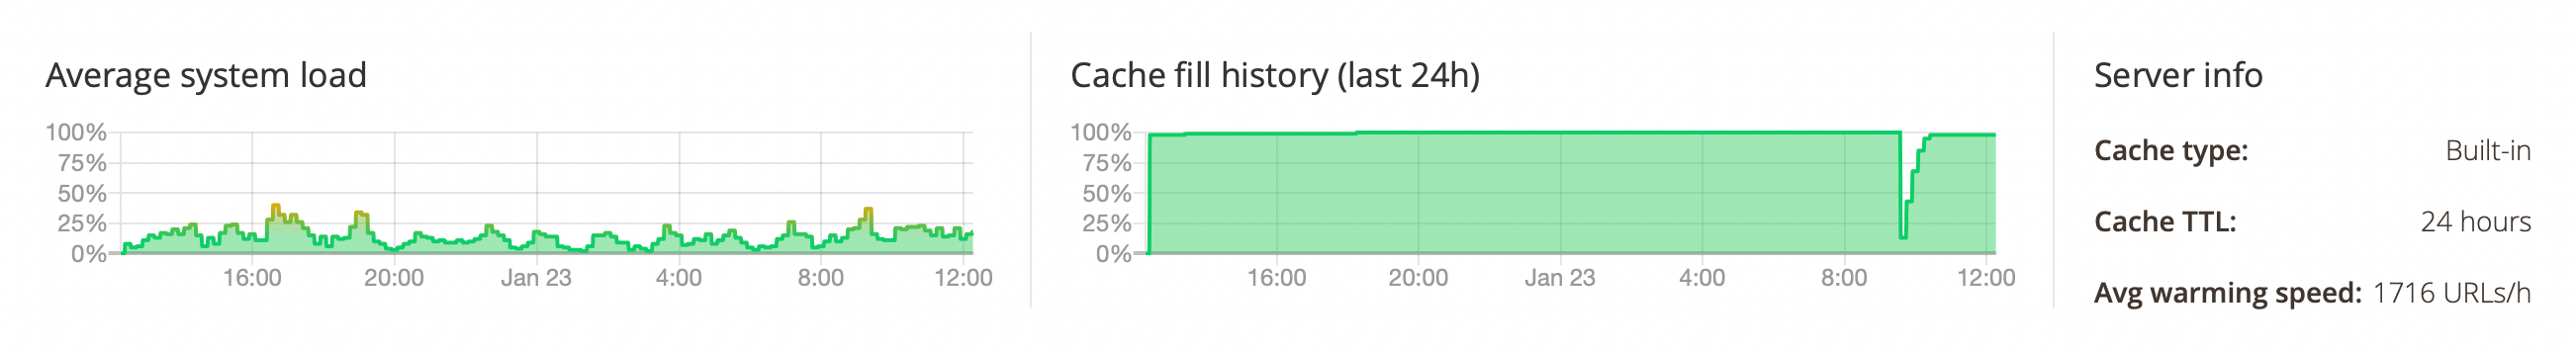
The info block with charts is divided into 3 sections:
- Average system load: displays the current average system, load.
- Cache fill history (last 24H): this chart displays the varying of the cache fill rate during the last 24 hours. The time on the chart is in GMT.
- Server info: additional information regarding the full page cache:
- Cache type: caching application configured in the store.
- Cache TTL: lifetime of the full page cache configured in the store.
- Average warming speed: approximate speed with which the extension warms pages on the store (URLs per hour). Actual current warming speed can be different from this value as it depends on the number of cached/pending pages, cache flushes, etc.
- Check test page: used for checking if your default Magento caching system is working.
Jobs table
The table shows the last running jobs and data about their execution.
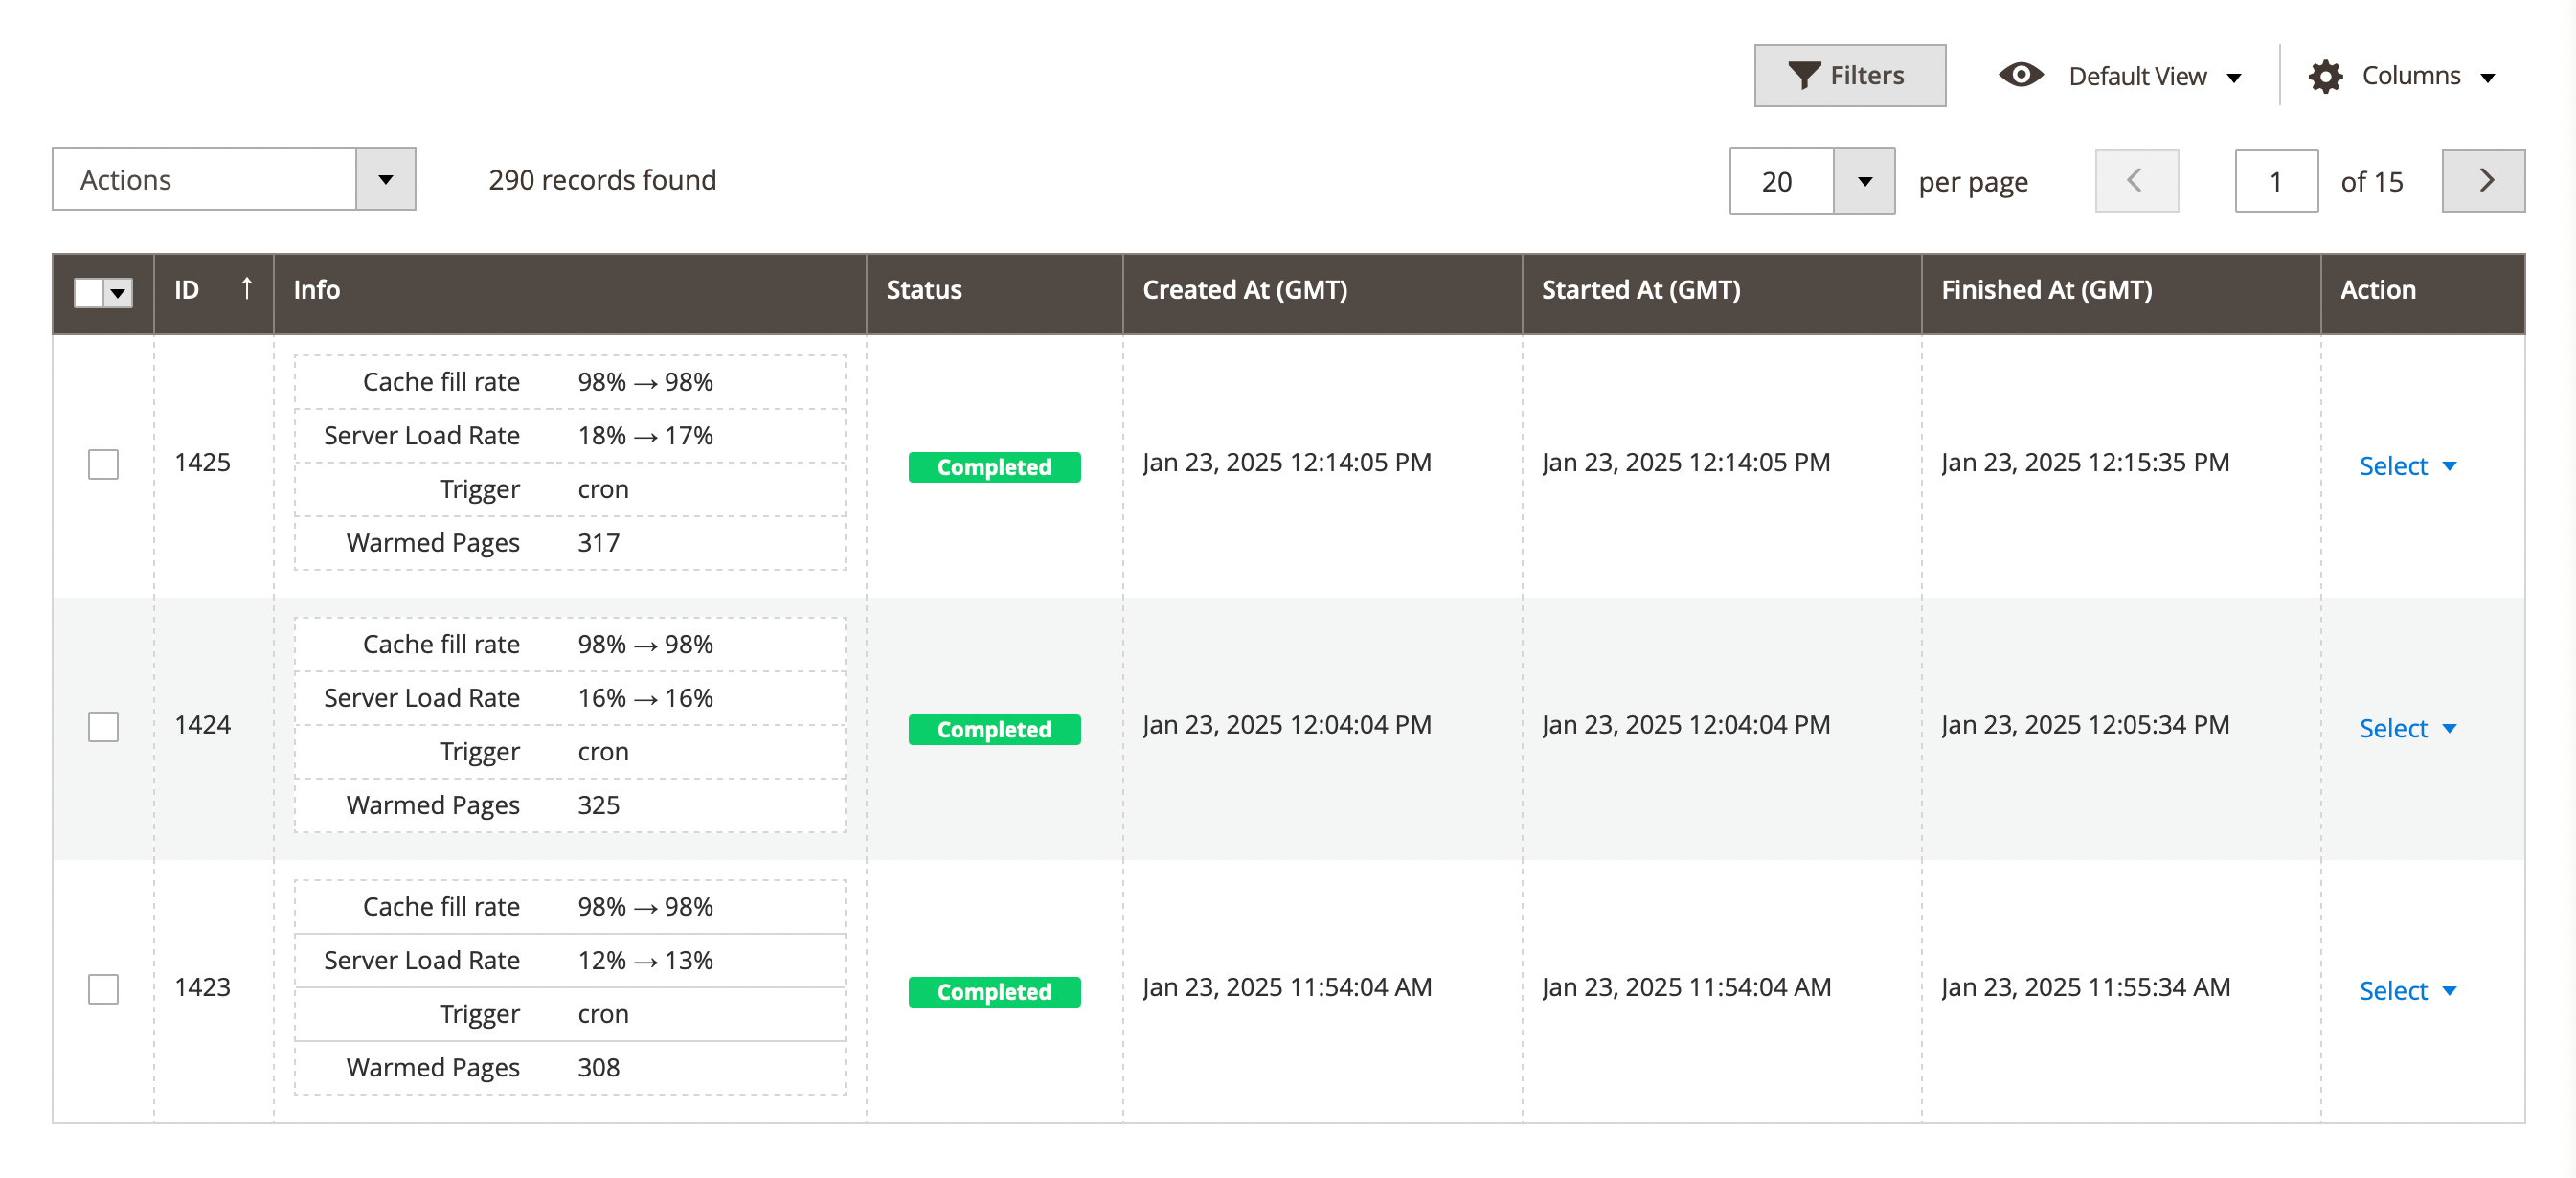
Here, you'll find the following columns:
- ID: item number.
- Status: current job status, which can take the following values:
- Completed: successfully finished job.
- Running: job is running right now.
- Missed: job was missed, to receive more details try to check Action -> Inspect trace report.
- Error: job was finished with the error, to receive more details try to check Inspect trace report.
- Created at (GMT): date then jobs was added to the table.
- Started at (GMT): date then jobs start running.
- Finished at (GMT): date then jobs was successfully finished.
- Action: used for manual management of records.
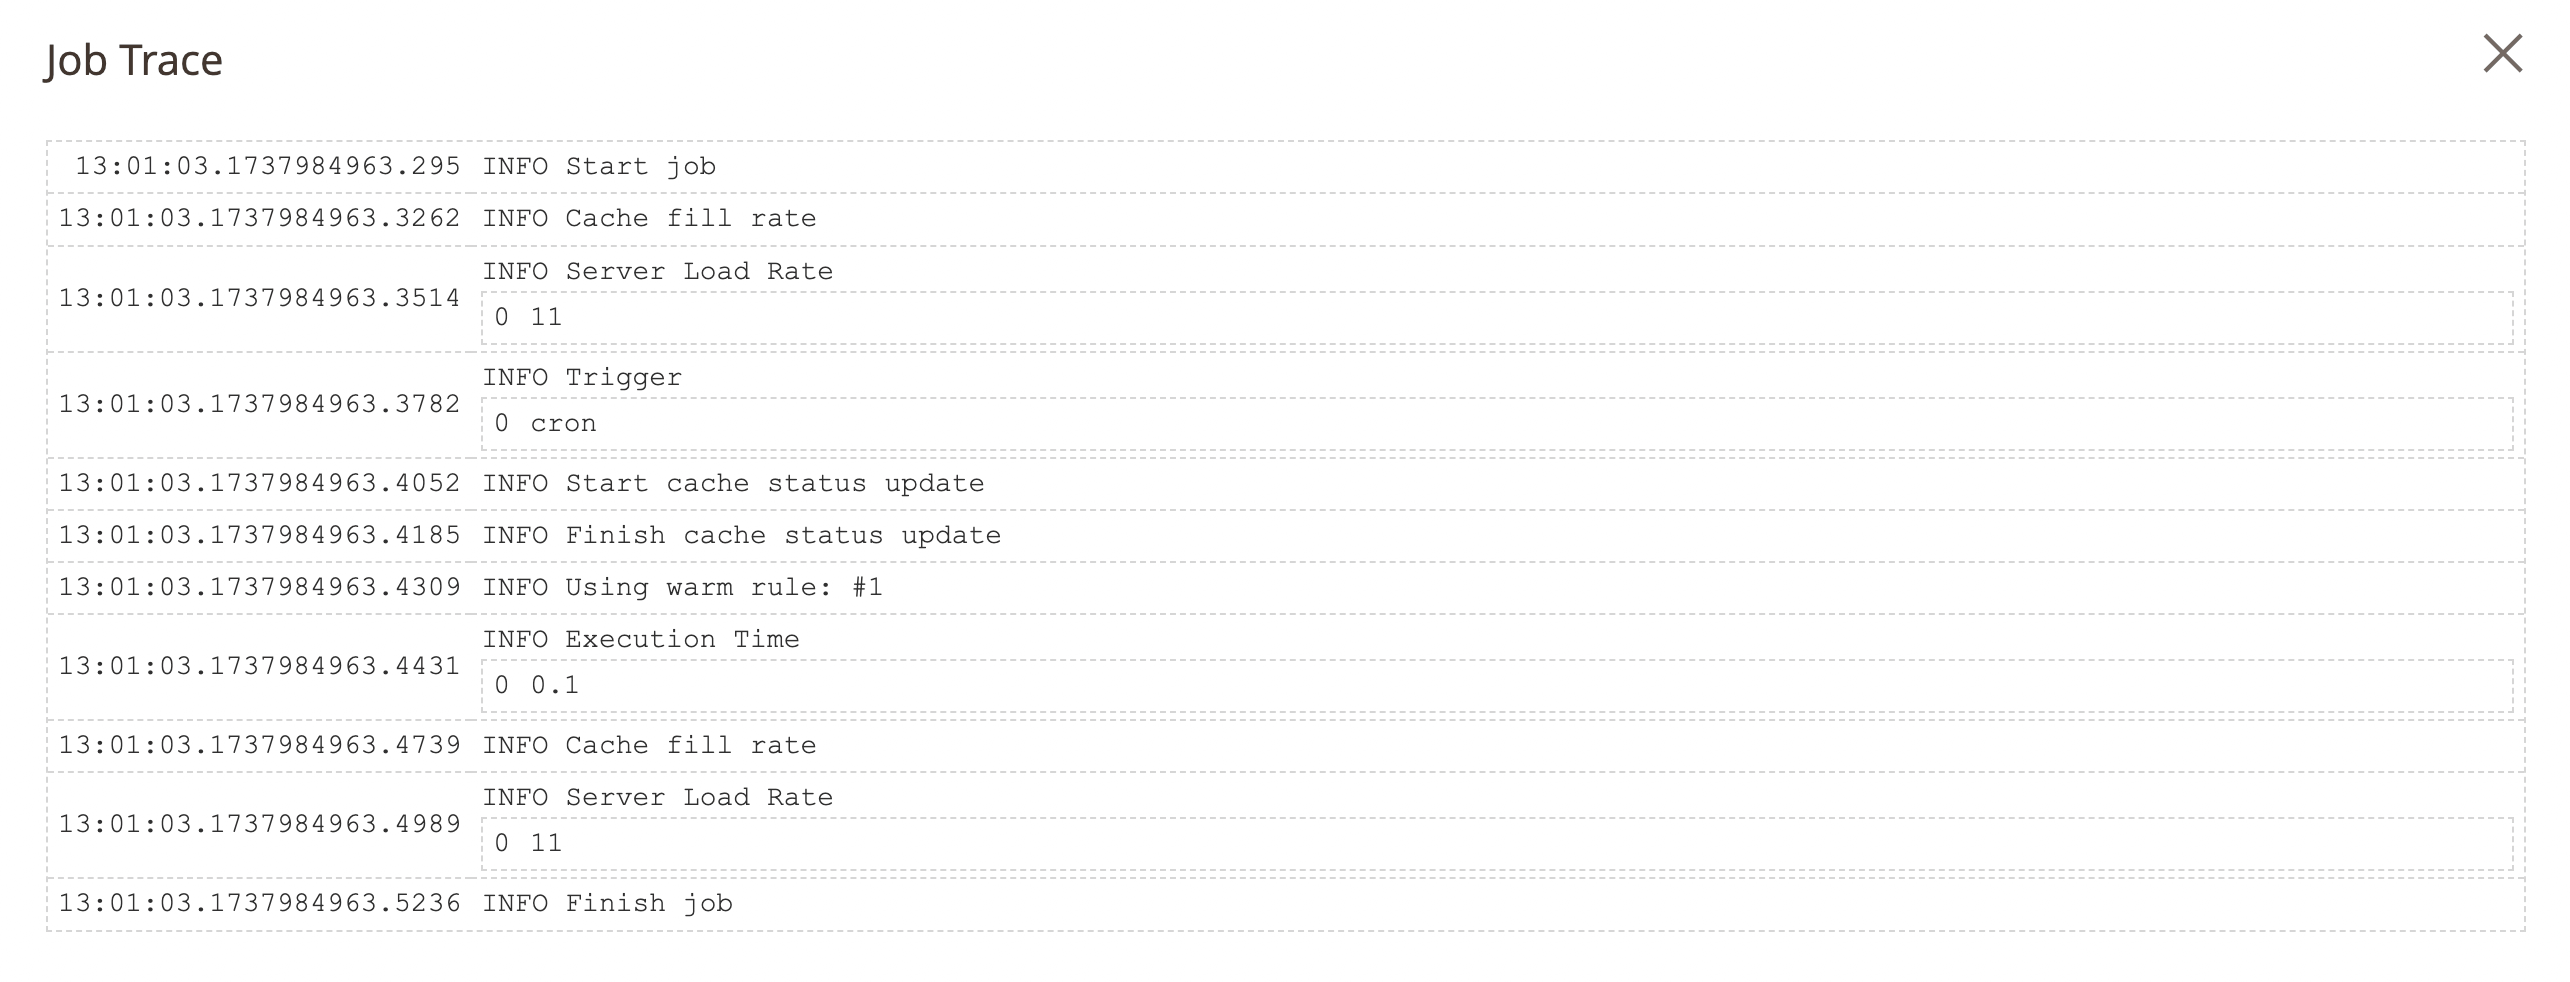
- Inspect trace: show detailed job statistic.
- Run job: manually run selected job.
- Delete: delete the jobs URL from list.
Example for Inspect trace report: