Reports interface
Quick explanation on main sections of the report interface.
While the interface of the reports may appear different from the native grids in the admin panel, the navigation and tools remain similar, ensuring that managing the reports is easy and intuitive.
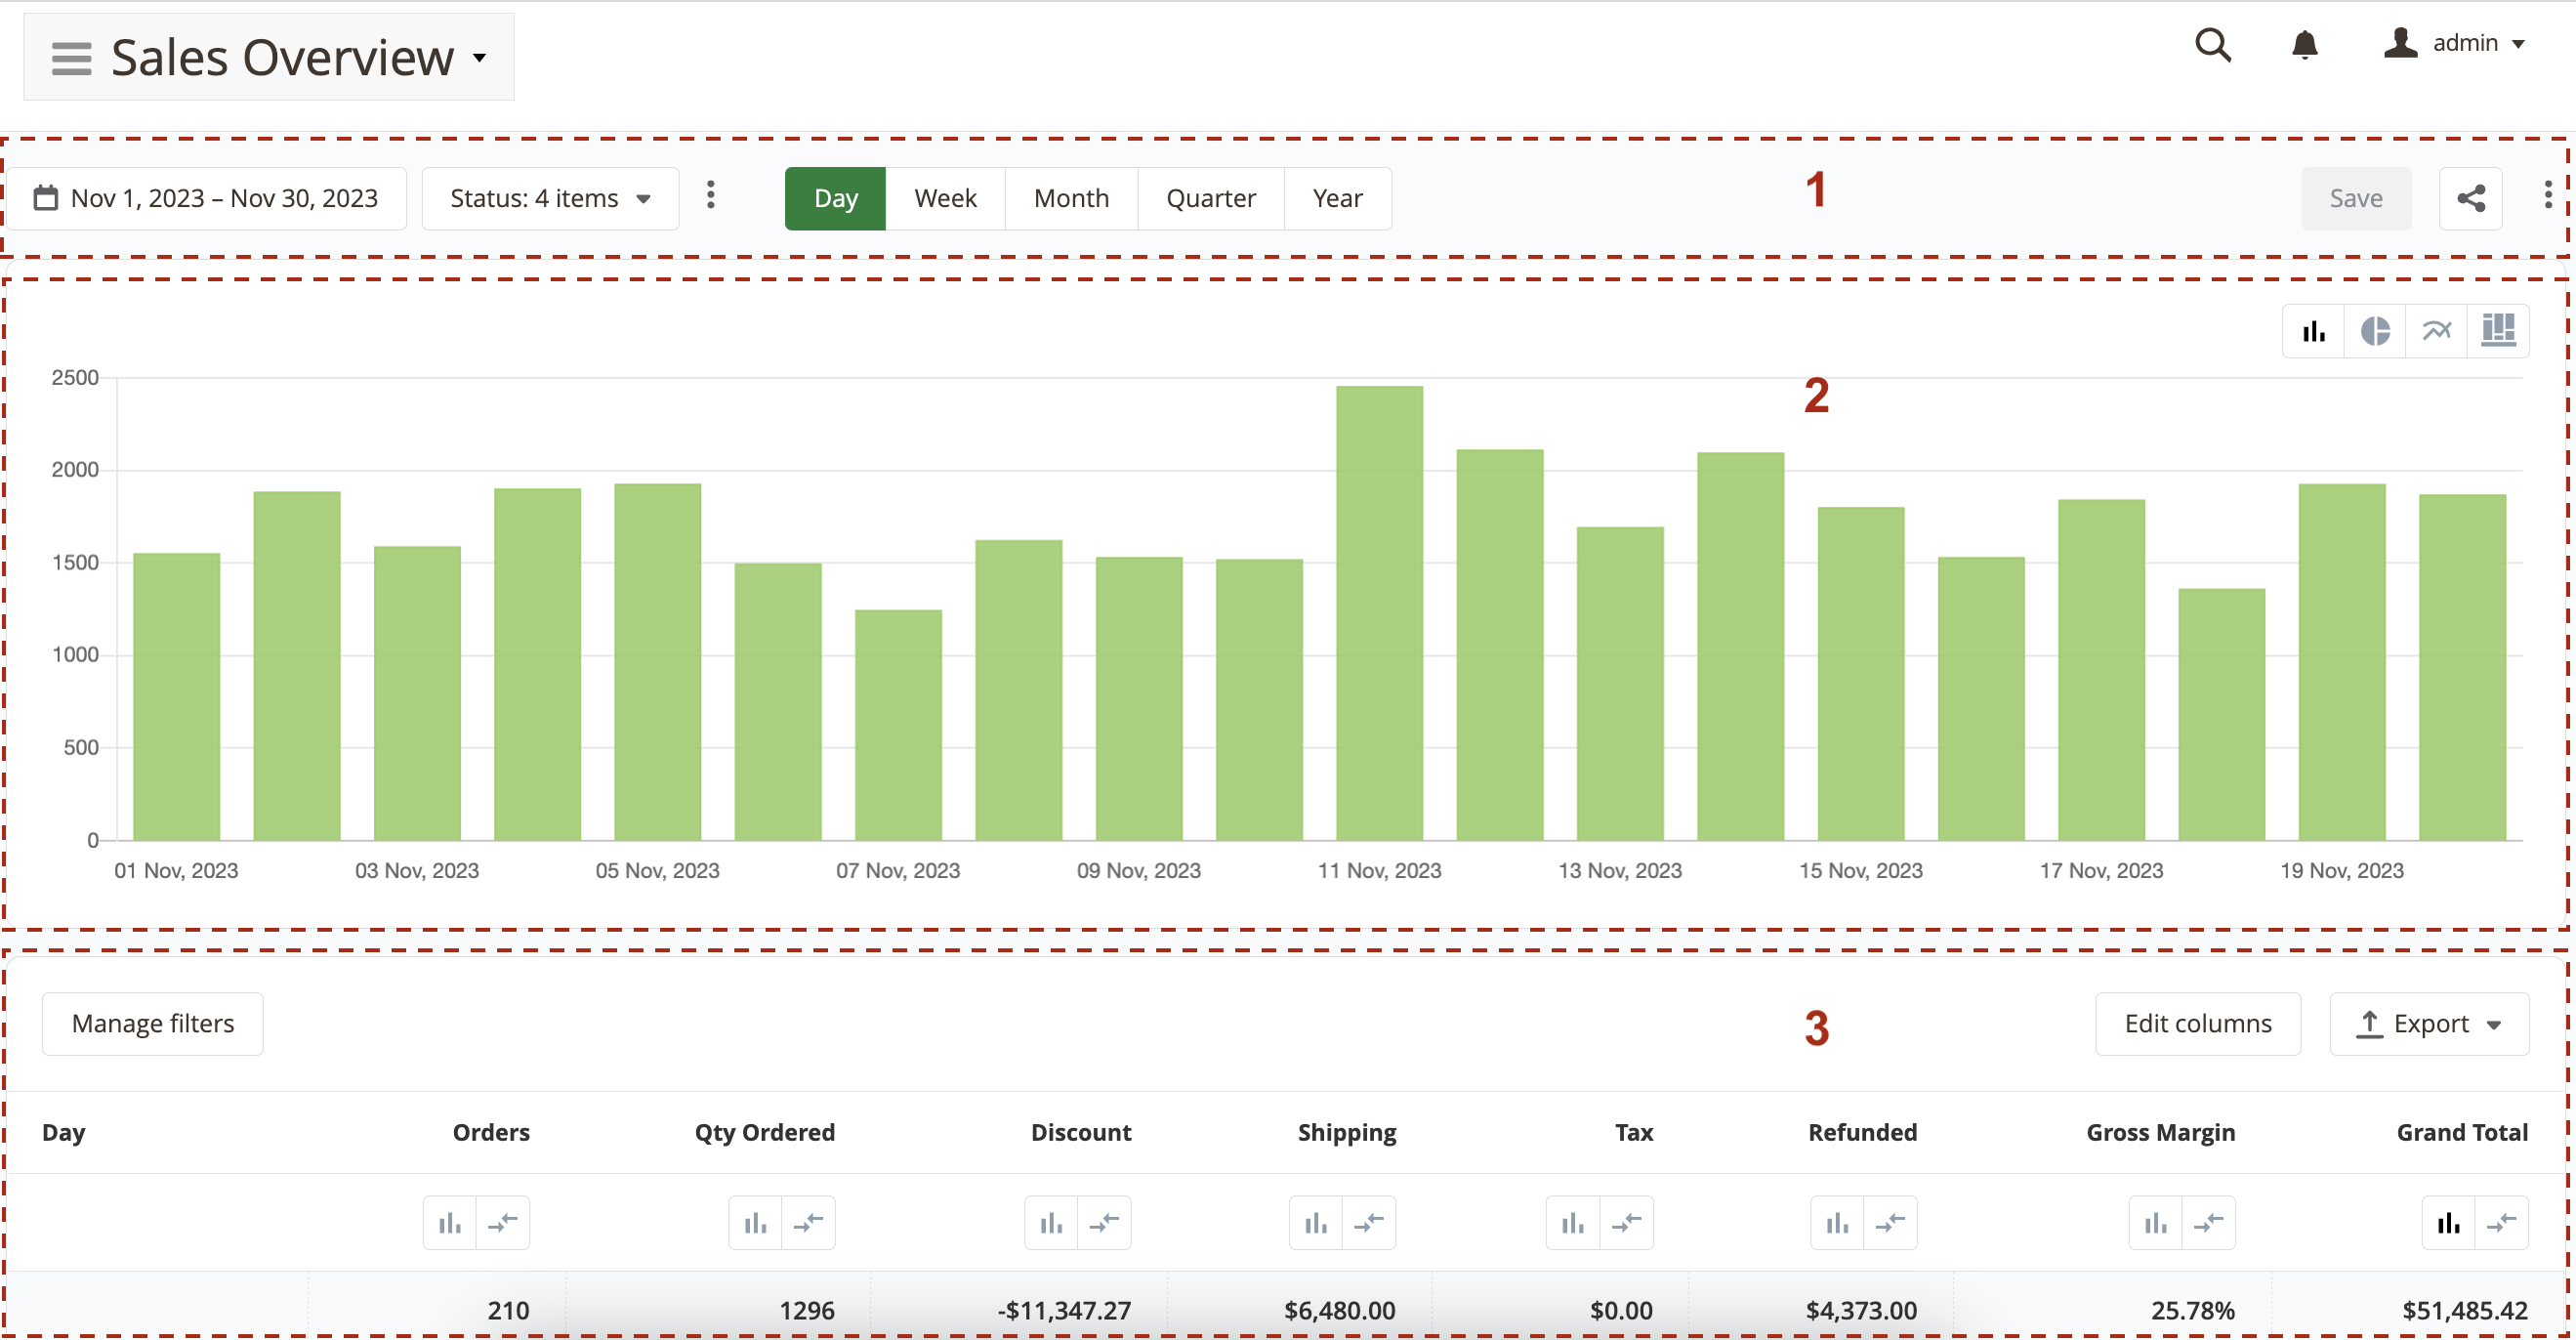
Each report interface consists of three main sections. Let’s explore each section in greater detail.
1. Toolbar

This section contains primary filters and report control buttons, including options to save, share, and edit the report. Here, users can select the time range of the report and apply primary filters defined in the Report Builder. It is possible to save the report state after making changes and enable/disable sharing. The Save, Share, and Edit buttons can be hidden for specific admin users using User Role Permissions settings. Further information can be found here.
2. Chart

This section allows users to visualize the data in the report using various types of charts. Users can switch between different chart types using the chart toolbar located in the top right corner of this section. In some reports, the chart section may be hidden. To display the chart, users can select the columns for which they would like to visualize the data by clicking the corresponding button near the column in the reports section.
3. Report
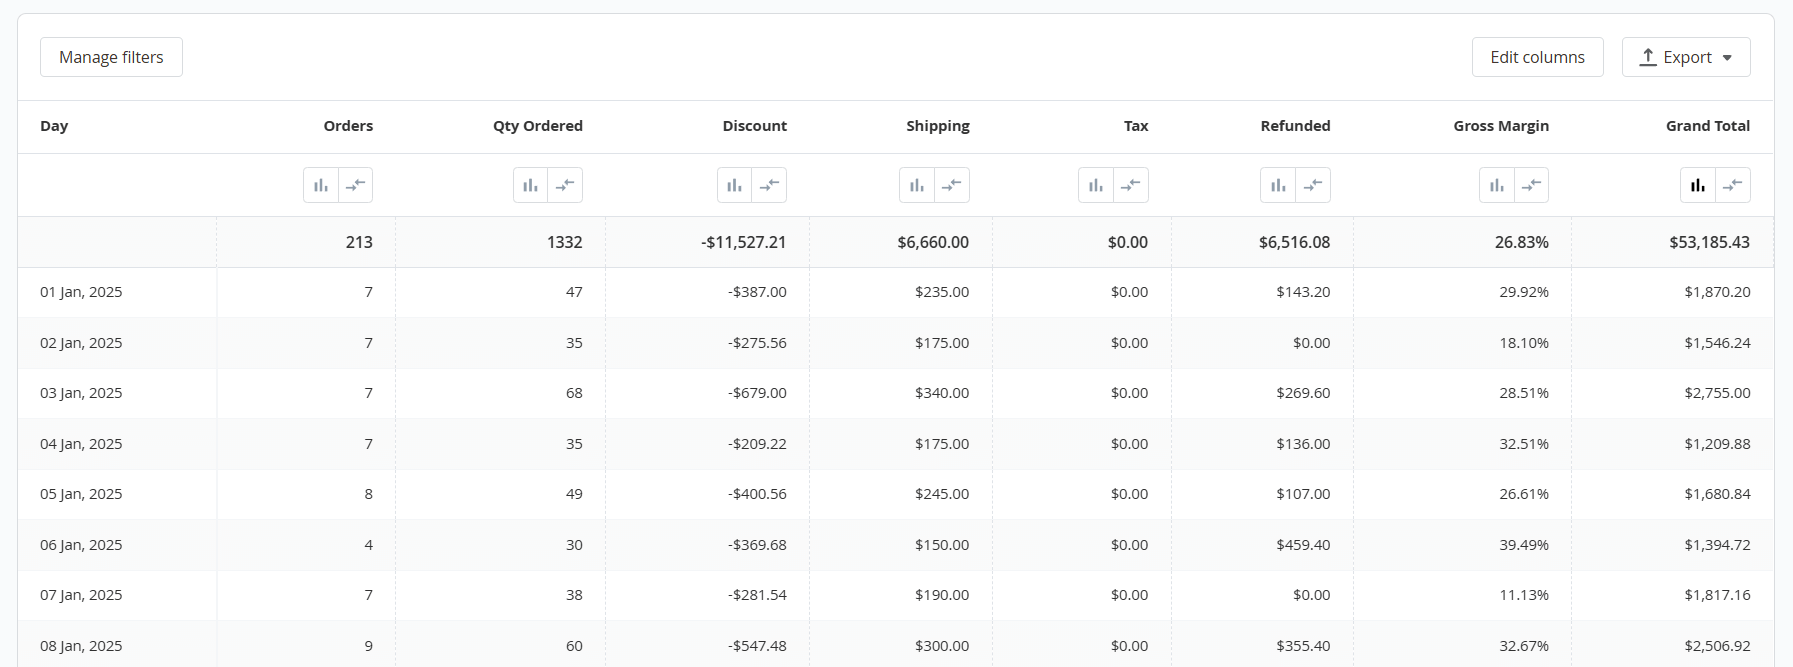
This section contains the actual report. It is divided into two inner sections - the toolbar and the report area.
-
In the toolbar section, users can filter the report by columns from the report itself or add additional filters. Users can also change the columns displayed in the report and export the report in CSV or XML format.
-
In the report area section, users can change the column by which the data in the report are sorted and the direction of the sort order. The number of rows displayed per page can also be adjusted using the pager toolbar at the bottom of the report area.