How to generate reports
The Reports section of the Help Desk module offers comprehensive insights into your support team's performance by visualizing key metrics and statistics. It allows you to track, analyze, and optimize customer service activities based on real-time data, enhancing operational efficiency.
Reports on our extension are divided into two separate menu actions:
- Refresh statistics, which is used in keeping statistics up to date and concentrating data for displaying.
- Reports, which is used in the visualization of data.
These actions can be selected from the menu drop-down in the Customer -> Helpdesk section.
If you haven't recently gathered statistics, you will have to go to Customer -> Helpdesk and select Refresh statistics. It will force data gathering and then redirect you to the Reports page, updated with your current data.
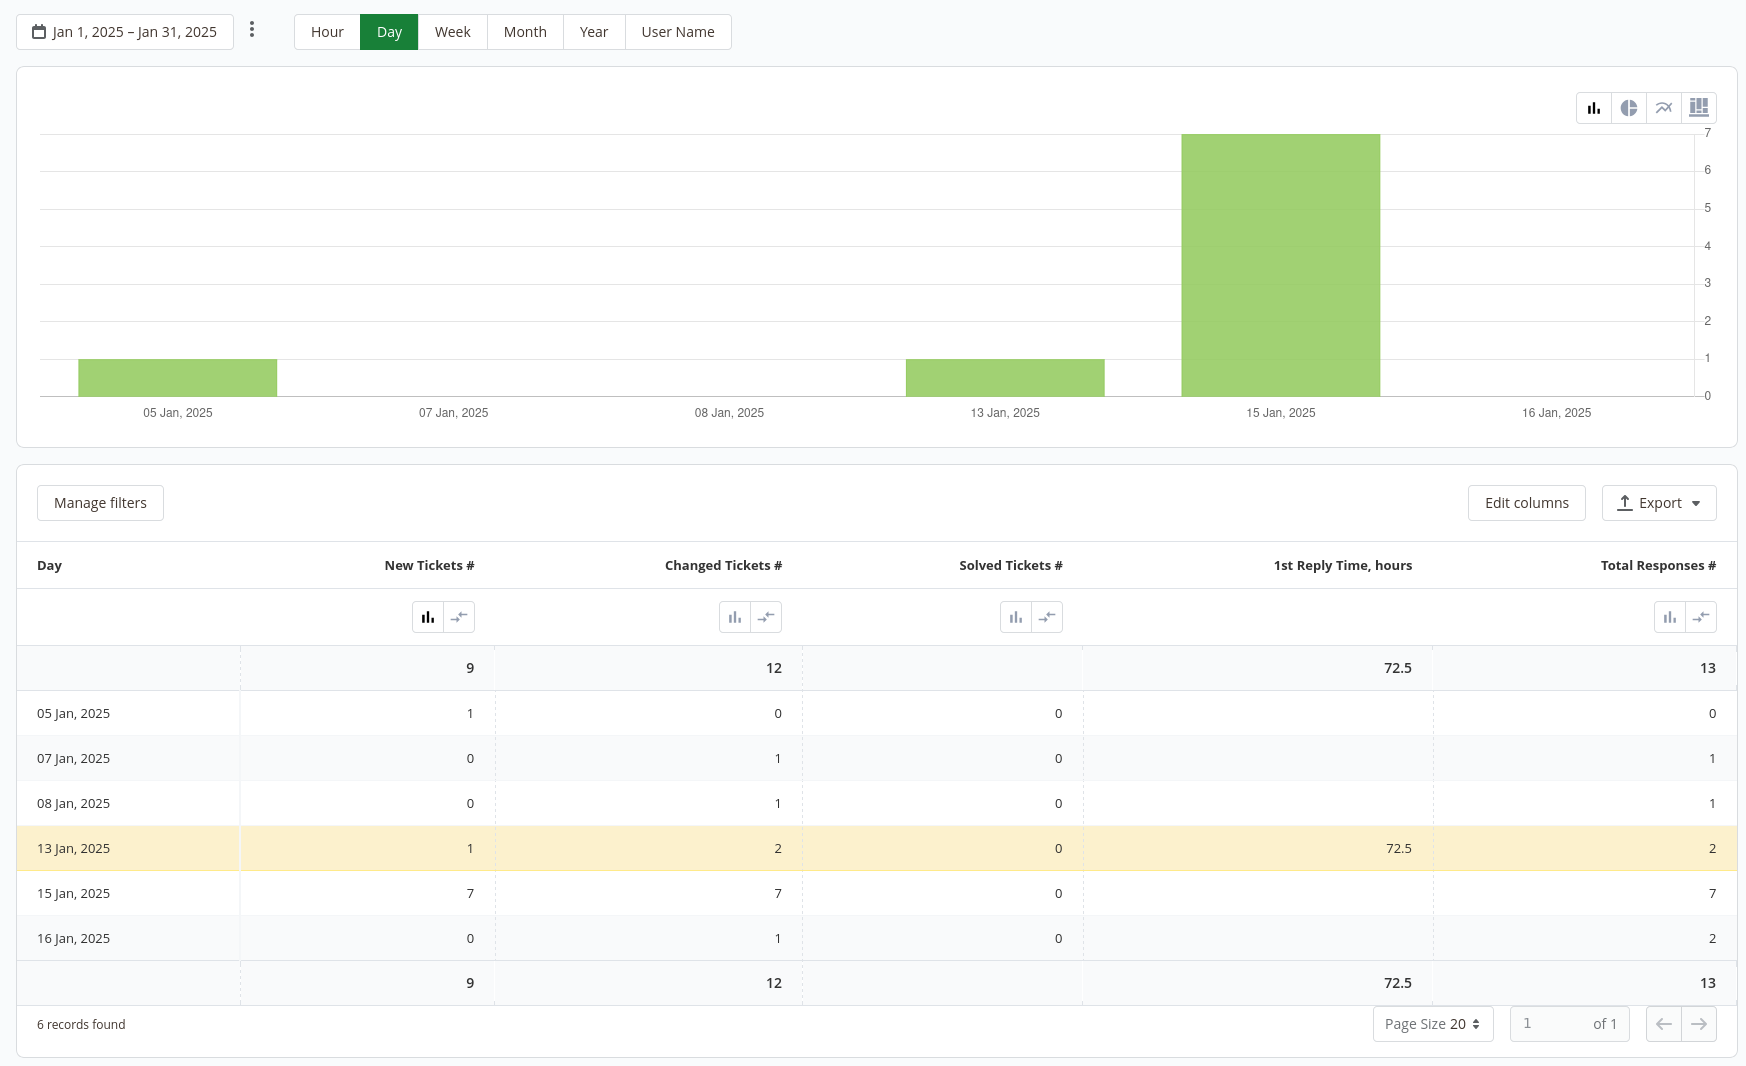
The report chart is built with the following parameters:
- Period: defines a time period for data visualization;
- User: defines the user, which is taken into account;
- Chart step: defines which step is taken for each row/chart bar.
Click on Manage filters on the buttons bar to show the following filters:
- Day
- New tickets
- Changed tickets
- Solved tickets
- 1st reply time, hours
- Total responses
Click on Additional filters to show the following additional filters on orders, order payments, invoices, customers, stock items, products, categories, customer addresses, order addresses, and payment transactions.
Edit columns: change the order of columns or remove them from the chart.
Export: exports the report in CSV or Excel XML file type.