FPC Reports
Note
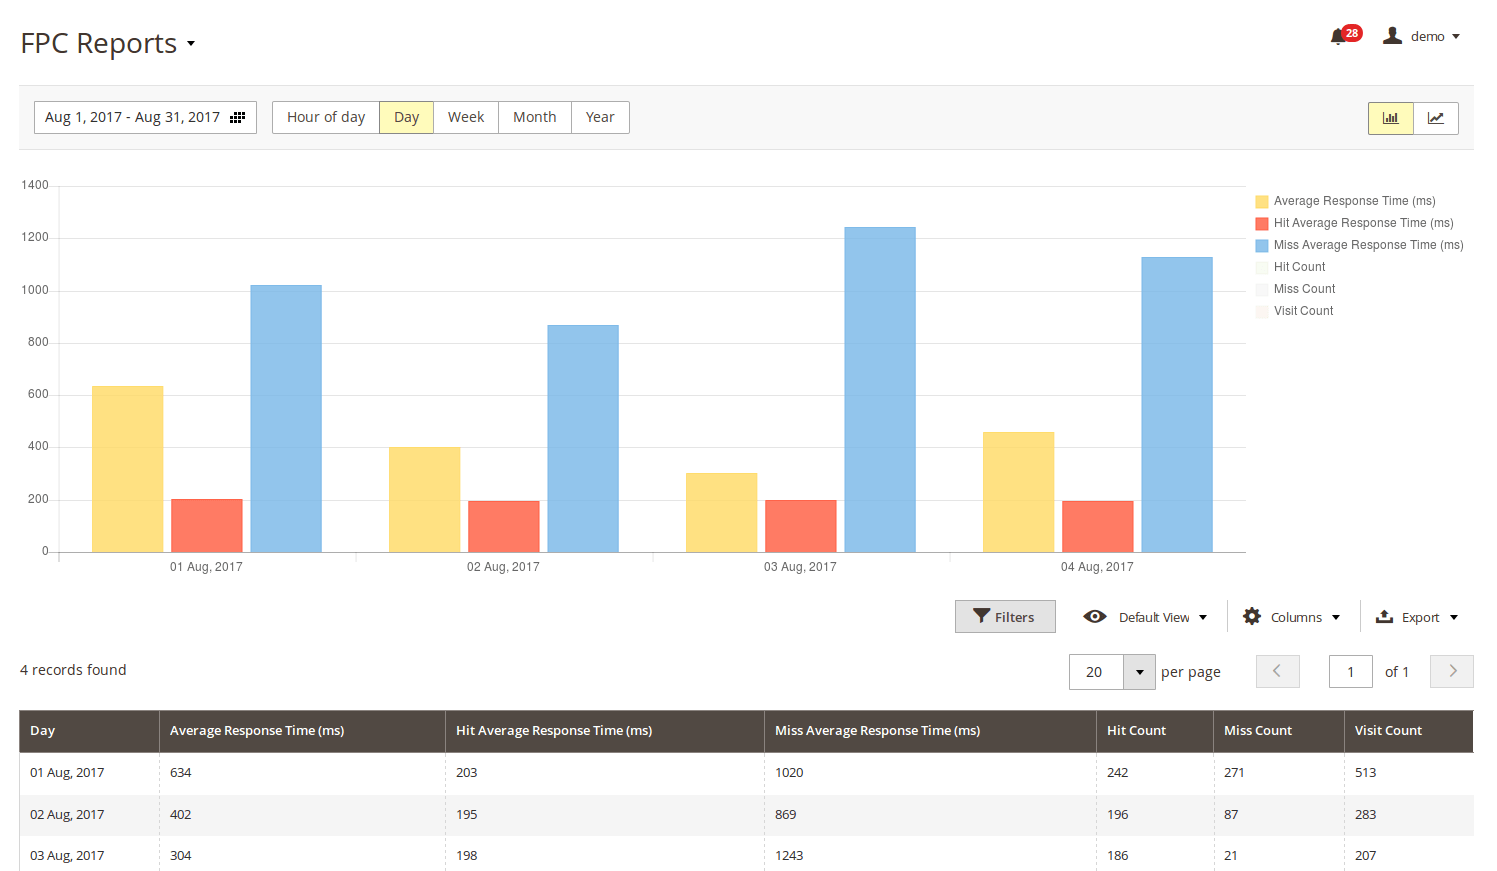
This functionality will work only for Built-in mode (will not work for Varnish).Average Response Time - the average time for Time To First Byte with cache and without cache.
Hit average response time - the average time for Time To First Byte for pages which are in the cache.
Miss average response times - the average time for Time To First Byte for pages without cache.

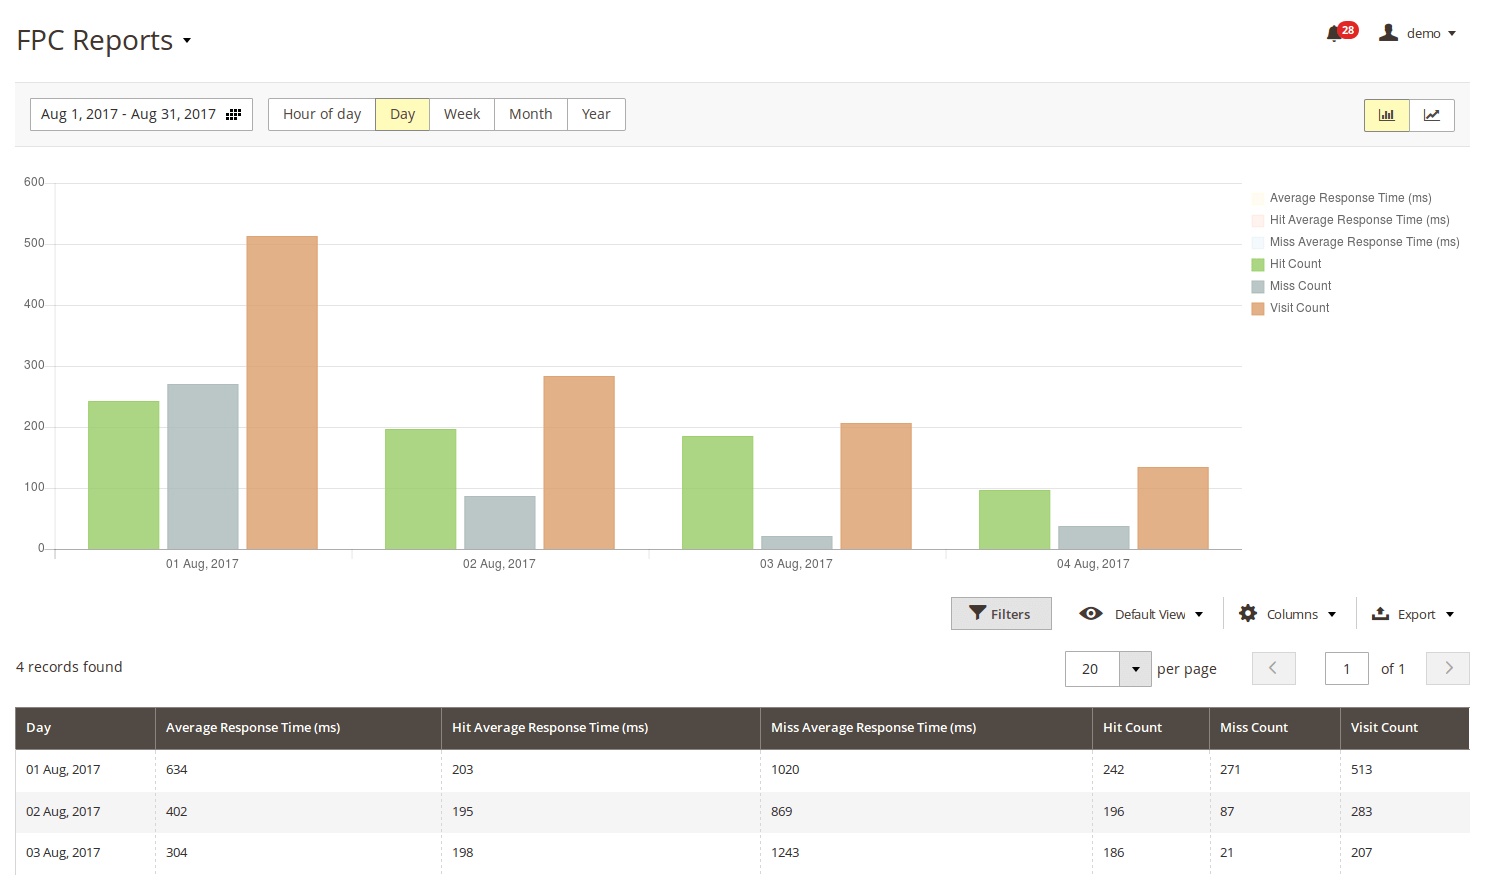
Hit Count - quantity of visited cached pages
Miss Count - quantity of visited pages which are out of cache
Visit Count - quantity of visited pages (in cache and out of cache)

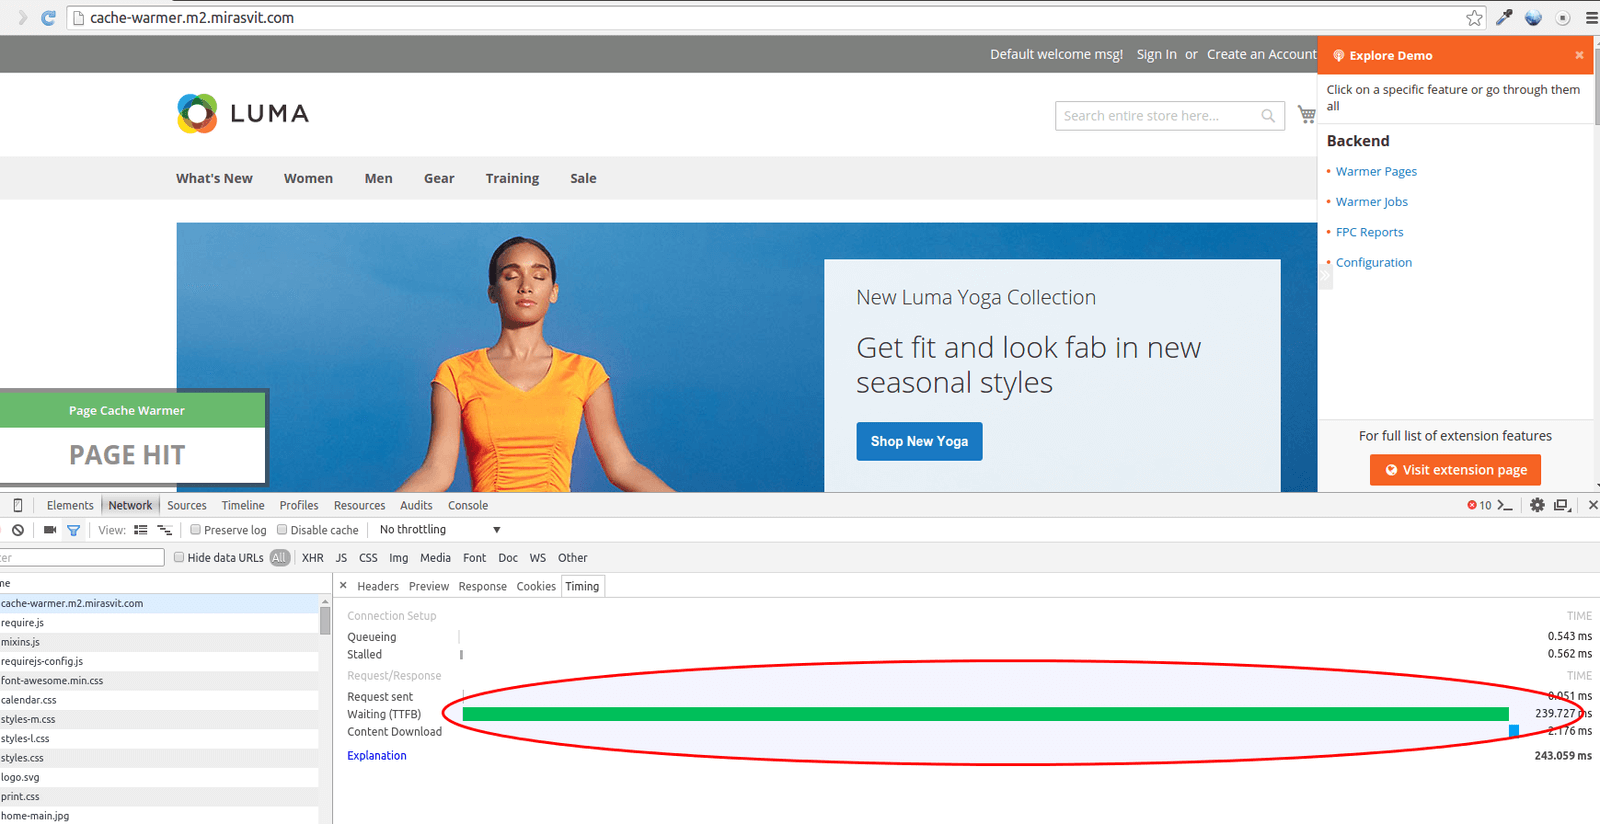
Time To First Byte - the time which you can see on following image:
 You can read More about Time To First Byte here https://en.wikipedia.org/wiki/Time_To_First_Byte