Reports interface
The Feed export report provides insights into the performance of product feeds by tracking customer interactions, orders, and revenue generated from marketplace referrals. This report helps merchants analyze how effectively their feeds drive traffic and conversions from external marketplaces.
To check it navigate to Catalog -> Advanced Product Feeds -> Reports
Report interface consists of three main sections. Let’s explore each section in greater detail.
Toolbar
This section contains the primary filters that allow users to customize the report based on their needs. Here, users can select a specific time range to analyze data for a particular period. This helps in tracking trends over time and identifying performance changes.

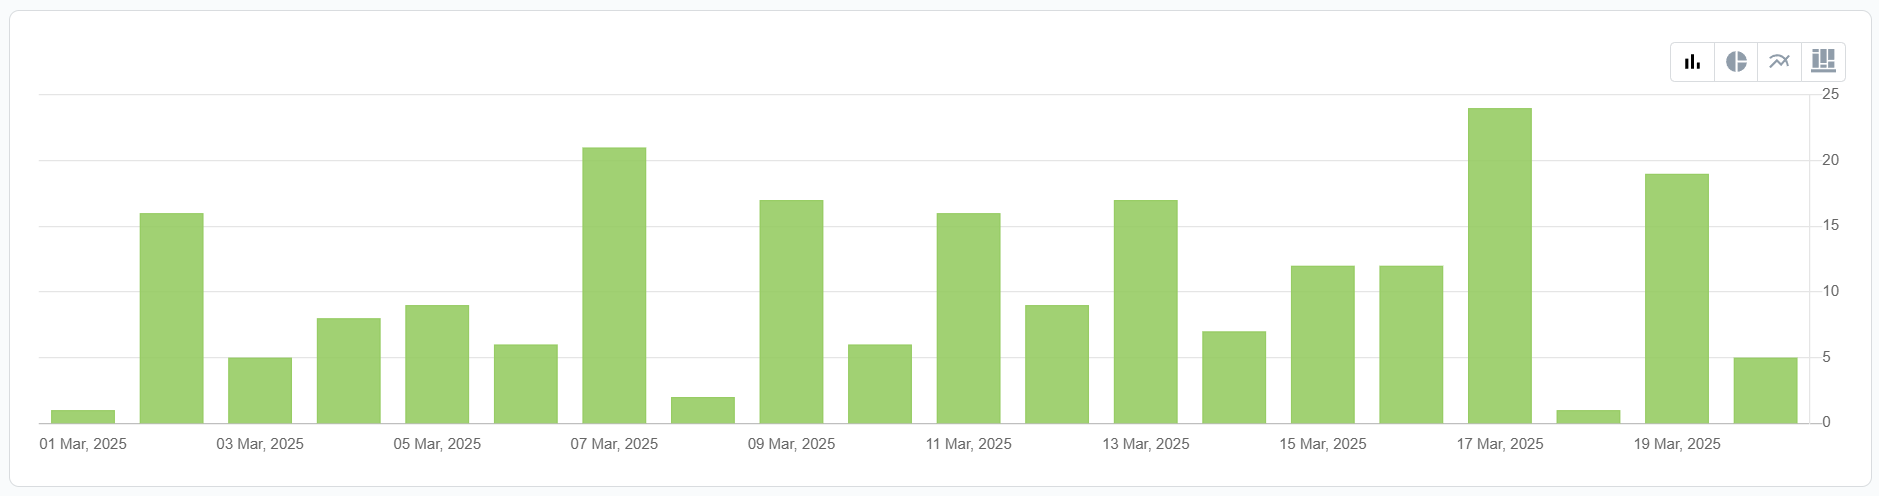
Chart
This section allows users to visualize report data using various types of charts, making it easier to identify trends and patterns at a glance. Users can switch between different chart types, such as line graphs, bar charts, or pie charts, depending on their preference and the type of data being analyzed. The chart toolbar, located in the top right corner.
Report
This section contains the actual report. It is divided into two inner sections - the toolbar and the report area.
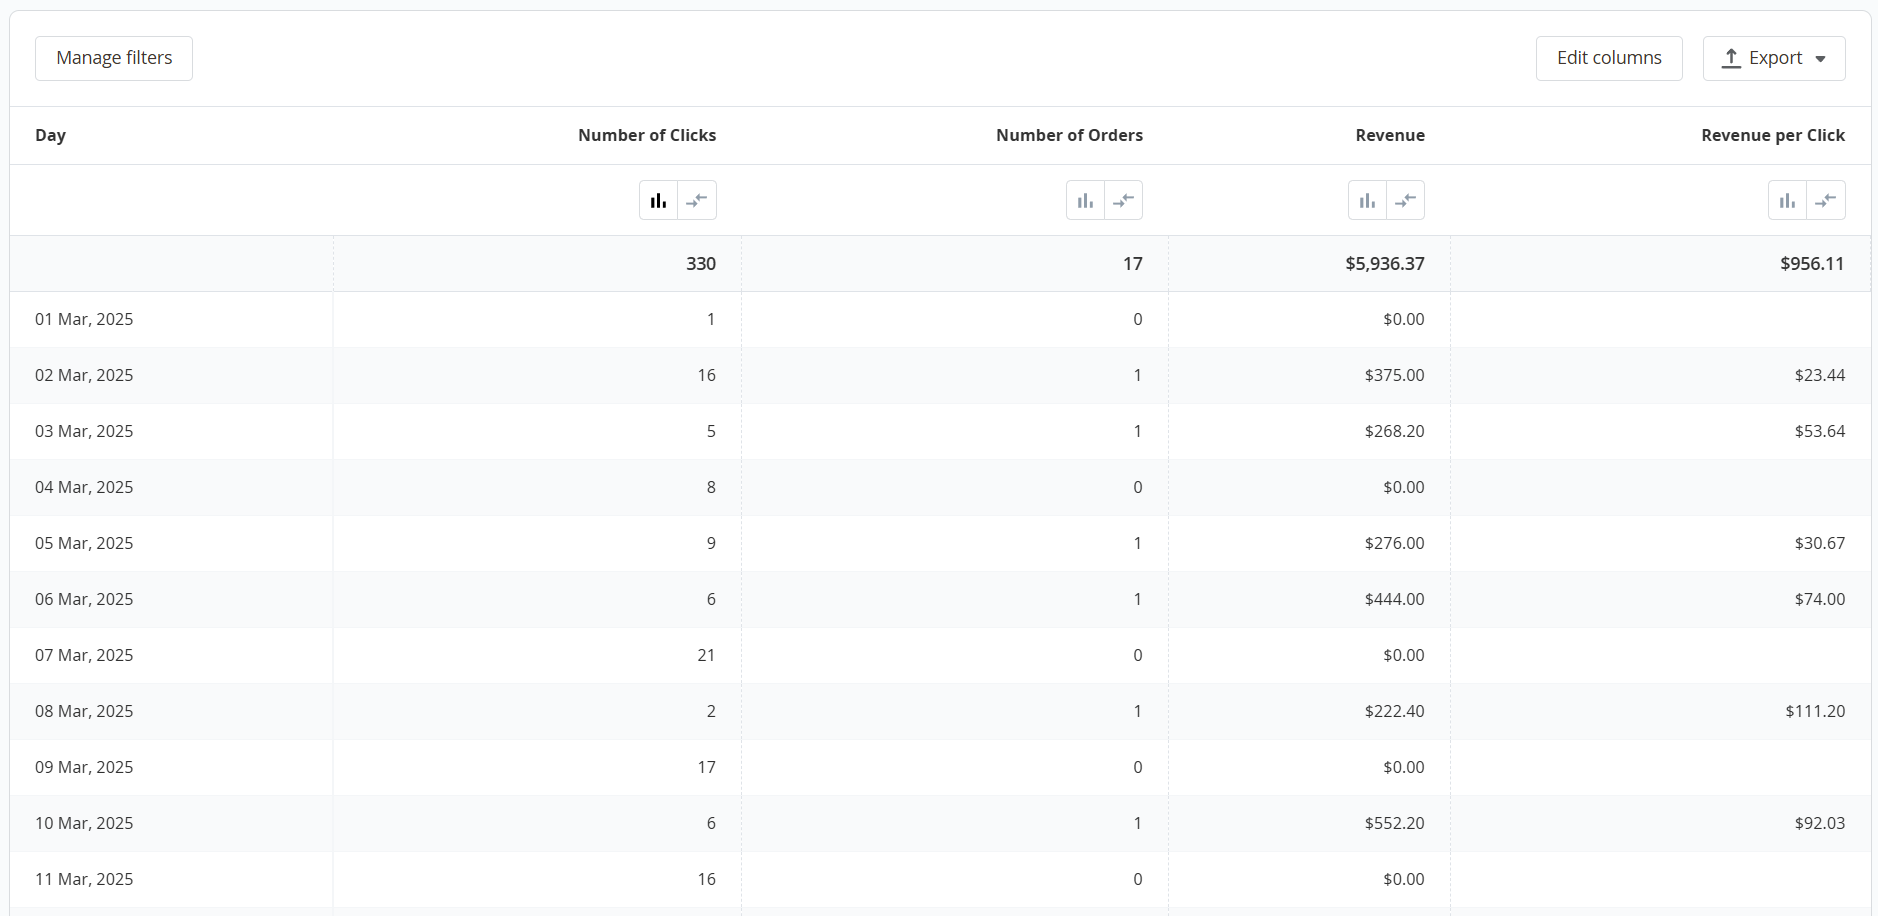
- Manage filters: use this button to open the filter section and customize the report based on available data.
- Edit columns: use this button to modify the columns displayed in the report.
- Export: use this button to export the report in CSV or XML format.
- Number of clicks: the total number of times customers clicked on a product listing and were redirected from the marketplace to your store.
- Number of orders: the total number of orders placed after a customer was redirected from the marketplace.
- Revenue: the total revenue generated from orders placed after the customer was redirected from the marketplace.
- Revenue per click: the average revenue generated for each individual click (Revenue ÷ Number of clicks).
Monitor marketplace traffic:
- Check the Number of clicks to see how many visitors your store is getting from external feeds.
- A high number of clicks but low orders may indicate an issue with product pricing, descriptions, or the checkout process.
Evaluate conversion performance:
- The Number of orders column helps determine how well traffic from a feed is converting into actual sales.
- If the conversion rate is low, consider optimizing product images, descriptions, or pricing strategies.
Analyze revenue impact:
- The Revenue column shows how much sales revenue each feed is driving.
- Use Revenue per click to measure profitability and determine if marketplace campaigns are cost-effective.
Tracking these metrics helps optimize feed performance and maximize return on investment (ROI).