How to Create Magento 2 Custom Reports
-
 Eugen Barilyuk
- E-commerce Tips & Best Practices
- Updated: Oct 16, 2025
- 13 min read

Reporting drives decisions, but built-in reports rarely answer the exact question behind a promotion, a delivery promise, or a margin dip. This guide shows how to design custom reports in Magento 2 that turn store data into clear, reusable answers.
You'll see when standard views are enough and when a custom view is better, how to choose a tool, and how to build your first report step by step in the Magento 2 Advanced Reports extension.
We'll cover the essentials: selecting dimensions and fields, adding filters and simple formulas, saving and sharing views, exporting results, syncing to Google Sheets, and a set of popular report patterns with real examples.
Table of Contents
- What Are Magento 2 Custom Reports
- Built-in vs Custom Reports (Pros & Cons)
- Three Ways to Build Custom Reports
- Choosing a Tool for Your Reports
- Create Your First Custom Report: Step by Step
- Popular Custom Report Types
- Recent Custom Report Examples
- Conclusion
What Are Magento 2 Custom Reports
Custom reports in Magento are tables and lightweight dashboards tailored to your store. They combine data from orders, customers, products, RMA, and inventory into a single view.
Choose the fields that matter, add filters and groups, and apply simple formulas to answer specific business questions. Build reports with a visual builder, export to CSV or Google Sheets, and share the results with your team.
Why Reporting Matters for E-commerce
With the right reports, trends become visible. Top sellers by region stand out, margin erosion is flagged early, low stock prompts action before it costs revenue, channels can be compared on the same scale, and delivery lead times stay on track.
Clear, repeatable views align teams, speed decisions, and show whether changes work.
Use built-in reports for routine checks. When a question needs different fields, joins, or calculations, switch to a custom report instead.
Built-in vs Custom Reports (Pros & Cons)
Built-in reports give you a quick, consistent snapshot. Open them to check today's orders, revenue, or top products. Definitions are the same for everyone, setup is minimal, and behavior is predictable. For daily monitoring and shared dashboards, they do the job well.
The limits show up when the question changes. Layouts are fixed, columns are predefined, joins with extension tables are not available, and derived metrics are out of scope.
If you want to compare results by customer group or region, link orders to subscriptions or RMA reasons, track delivery lead time, or look at margin instead of revenue, the default views fall short.
A custom report gives you the view that matches your business. Select the fields that matter, apply filters and groups, join data from extensions, and add the calculation you rely on. Save the view, share a link with the team, and reuse it next month without rebuilding.
Use built-in reports for speed and consistency, and switch to a custom report when depth, precision, or joined data is required.
Three Ways to Build Custom Reports
You already know when to go beyond the defaults. The next decision is the method. Choose the route that fits your skills, tools, and timeline.
SQL queries against the store database
If you write SQL, you can join the tables you need and return a grid in the admin. This works for one-off analysis but costs engineering time, is hard to reuse, and usually lacks manager-friendly sorting, filtering, and export options.
External BI platforms
Tools like Microsoft Power BI and Exploratory handle modeling and rich visuals when an analyst maintains the pipeline. They shine for cross-system dashboards. Plan for connector setup, data preparation, and ongoing care to keep numbers aligned with the store.
Magento extensions
A purpose-built module keeps you in the admin with a visual builder for fields, filters, grouping, and simple formulas. Save views, share them, and export data.
When a report needs extra inputs, join tables from other extensions or custom entities. Use Config Builder once to define a new field or table, then design reports in the drag-and-drop Report Builder. Setup is quick for most stores, and managers stay in a familiar interface. Ongoing engineering effort is minimal.
If this route suits your workflow, duplicate an existing report, adjust columns and filters, save the view, and share a link.
Your next step is deciding where these reports will live: inside the admin with an extension or in an external BI platform.
Choosing a Tool for Your Reports
Choosing a tool starts with a simple question: where will the reports live? One path keeps everything inside the store admin with an extension. The other sits outside the platform in a business intelligence system that blends commerce data with finance, marketing, and other sources.
Extensions in the Admin
Extensions let you design views in a familiar interface, save and share them, and export results when needed. Setup is quick and maintenance is light, which suits managers and operators who work in the backend every day.
At Mirasvit, we offer the Advanced Reports extension for Magento 2. It provides ready reports and a visual builder, covers more than 300 fields across sales, customers, products, and inventory, supports calculated metrics and joins to extension tables, exports to CSV, XLSX, and PDF, syncs to Google Sheets, and can email reports on a schedule.
Other vendors ship comparable modules with their own strengths. If budget matters, review licensing and support terms on the vendor sites before deciding; plan types change over time.
Short comparison of extensions
| Extension | Best for | Highlights |
|---|---|---|
| Mirasvit Advanced Reports | Day-to-day reporting in the admin | 20+ ready views, drag-and-drop builder, 300+ fields, joins, Sheets sync, email schedules |
| Amasty Advanced / Custom Reports | KPI tracking with strong filtering | KPI widgets, scheduling, integrations with Amasty modules |
| Aheadworks Advanced Reports | Manager dashboards | 12–18 built-in reports, forecast module, drill-down charts |
| Mageplaza Custom Reports | Simple builds on a budget | Basic drag-and-drop builder, sales funnel, abandoned carts, email delivery |
If budget is a factor, review licensing and support terms on vendor sites; plans and limits change over time.
BI Platforms
Business intelligence platforms pull store data together with other systems to answer cross-department questions. Typical choices include Microsoft Power BI and Exploratory.
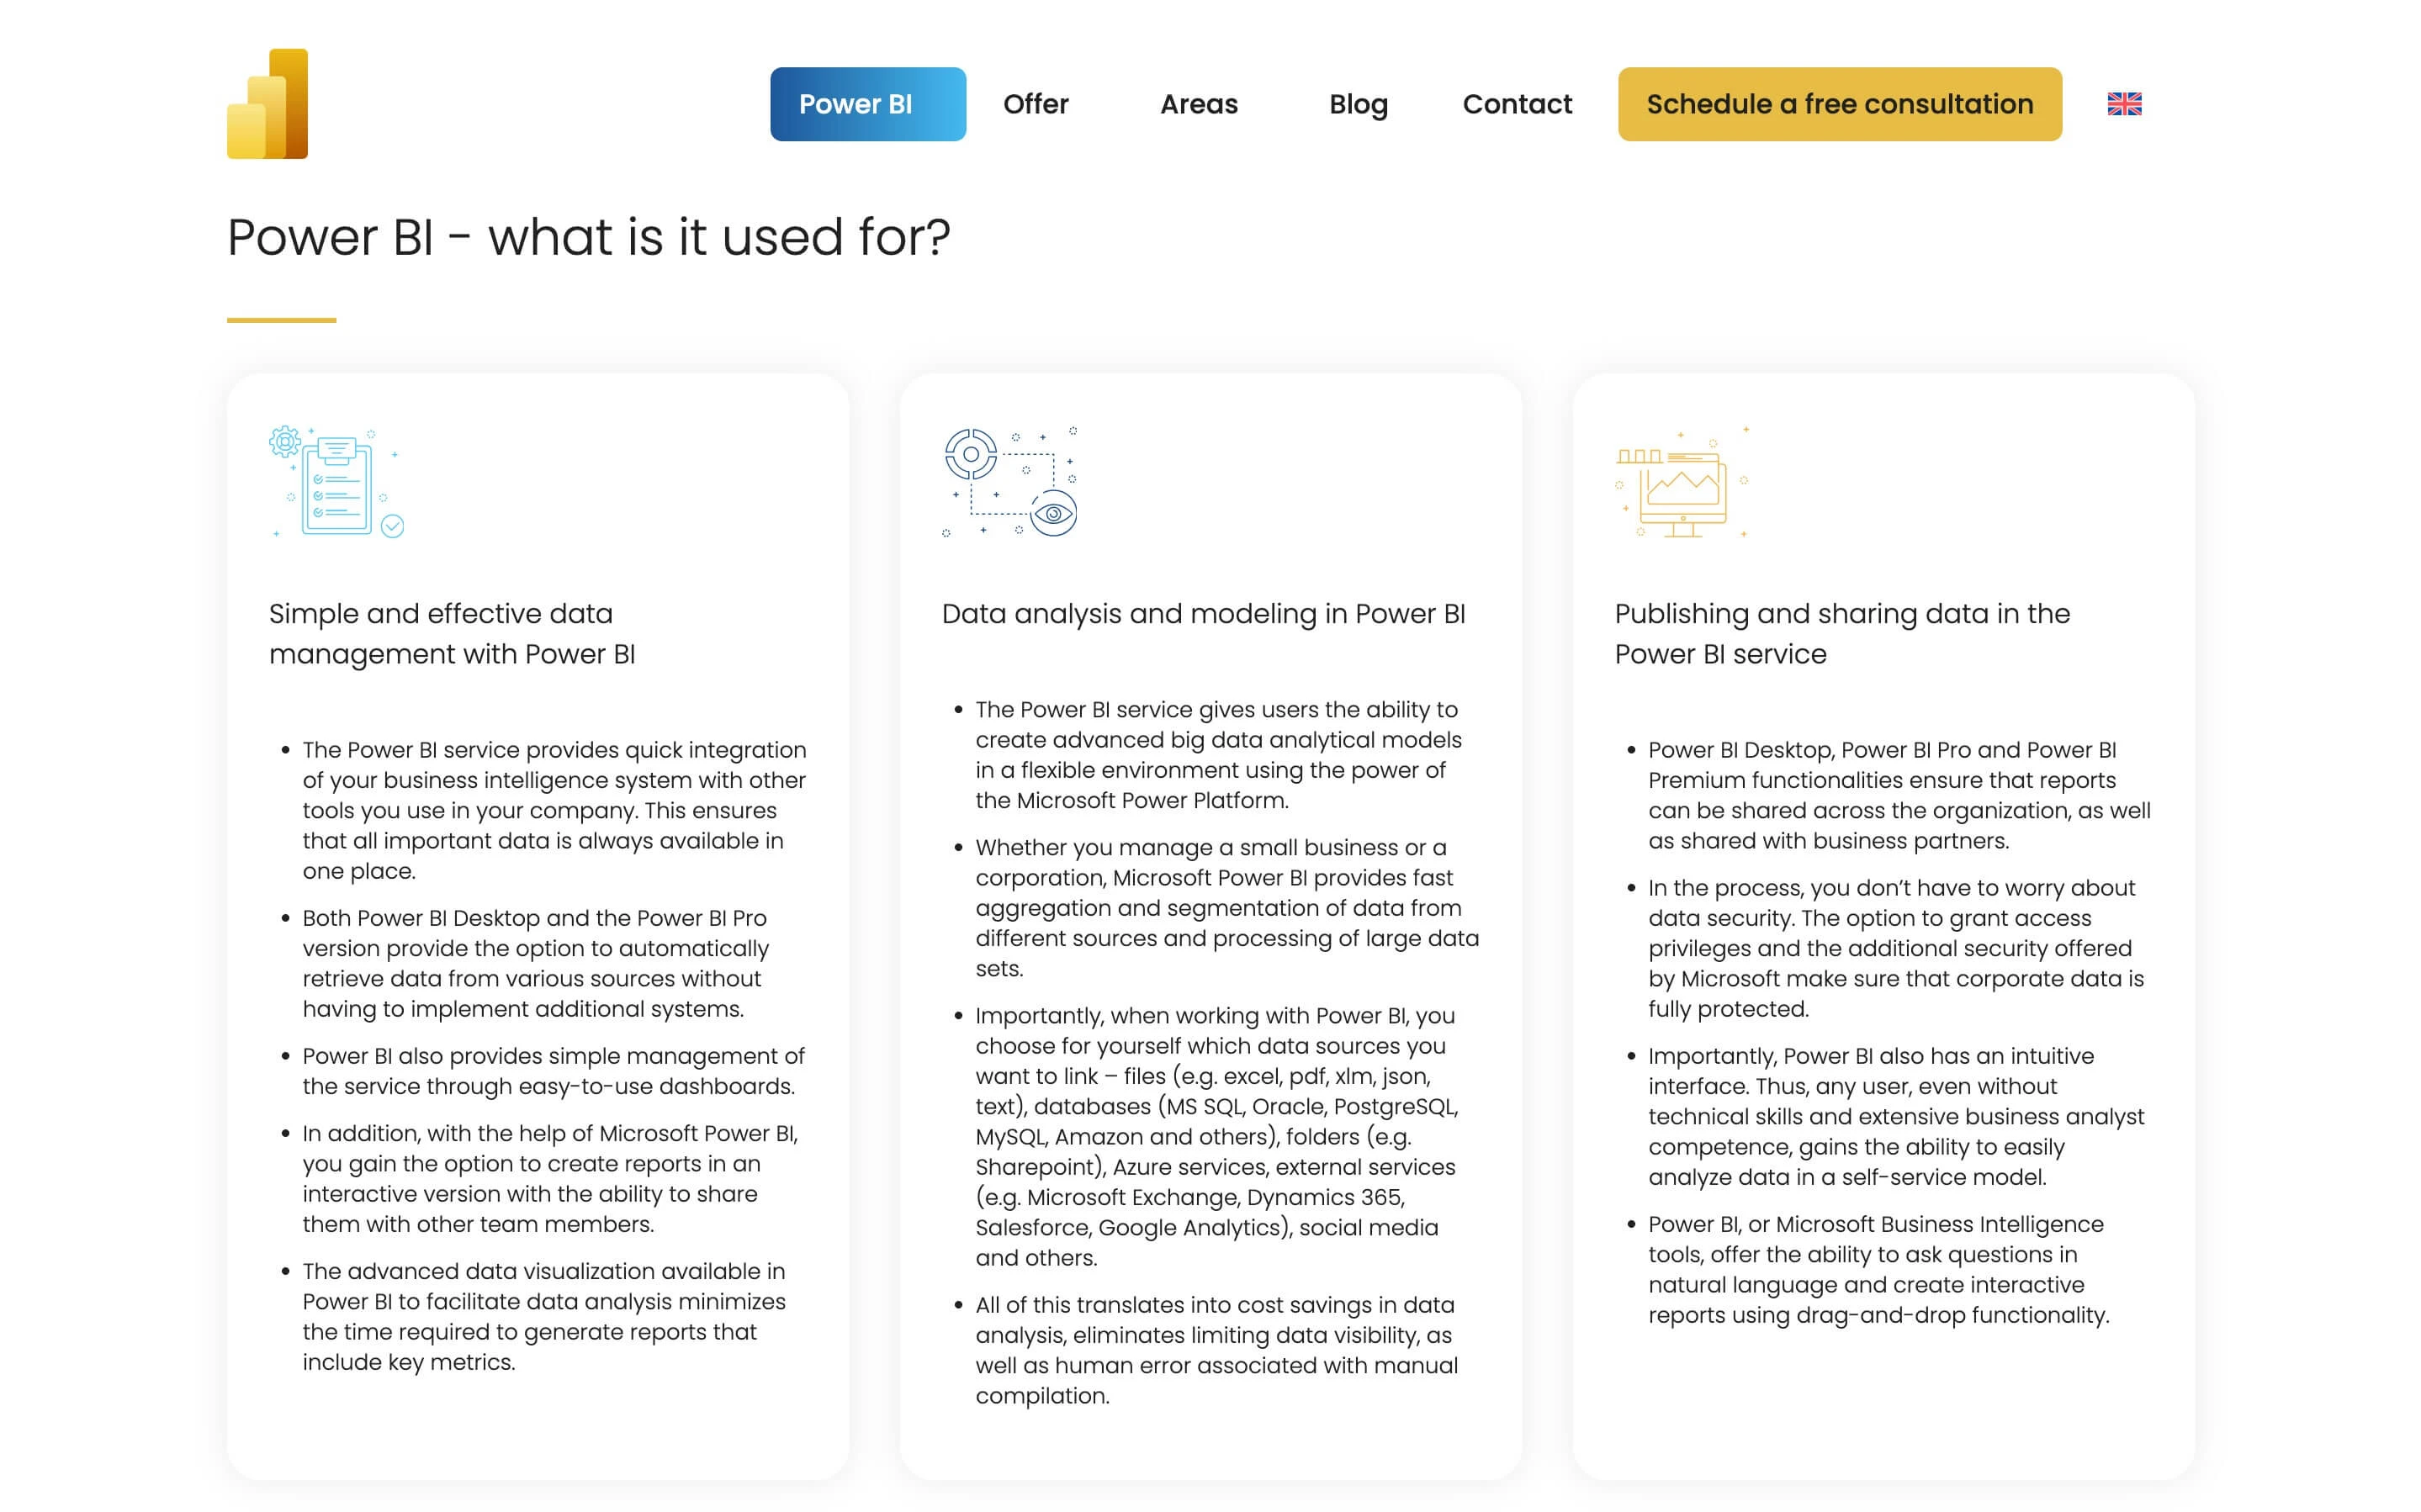
You gain broad flexibility, advanced visuals, and company-wide dashboards. The trade-off is connector setup, data modeling, and ongoing care from an analyst, with a focus less specific to day-to-day commerce operations.
In short, choose an extension when teams need quick answers inside the admin with minimal overhead. Choose a BI platform when the company already runs central dashboards and an analyst maintains the pipeline.
For teams who work in the backend daily and want results without coding, an extension is the most direct route. The walkthrough below uses our Advanced Reports module to show the full flow inside the admin.
Create Your First Custom Report: Step by Step
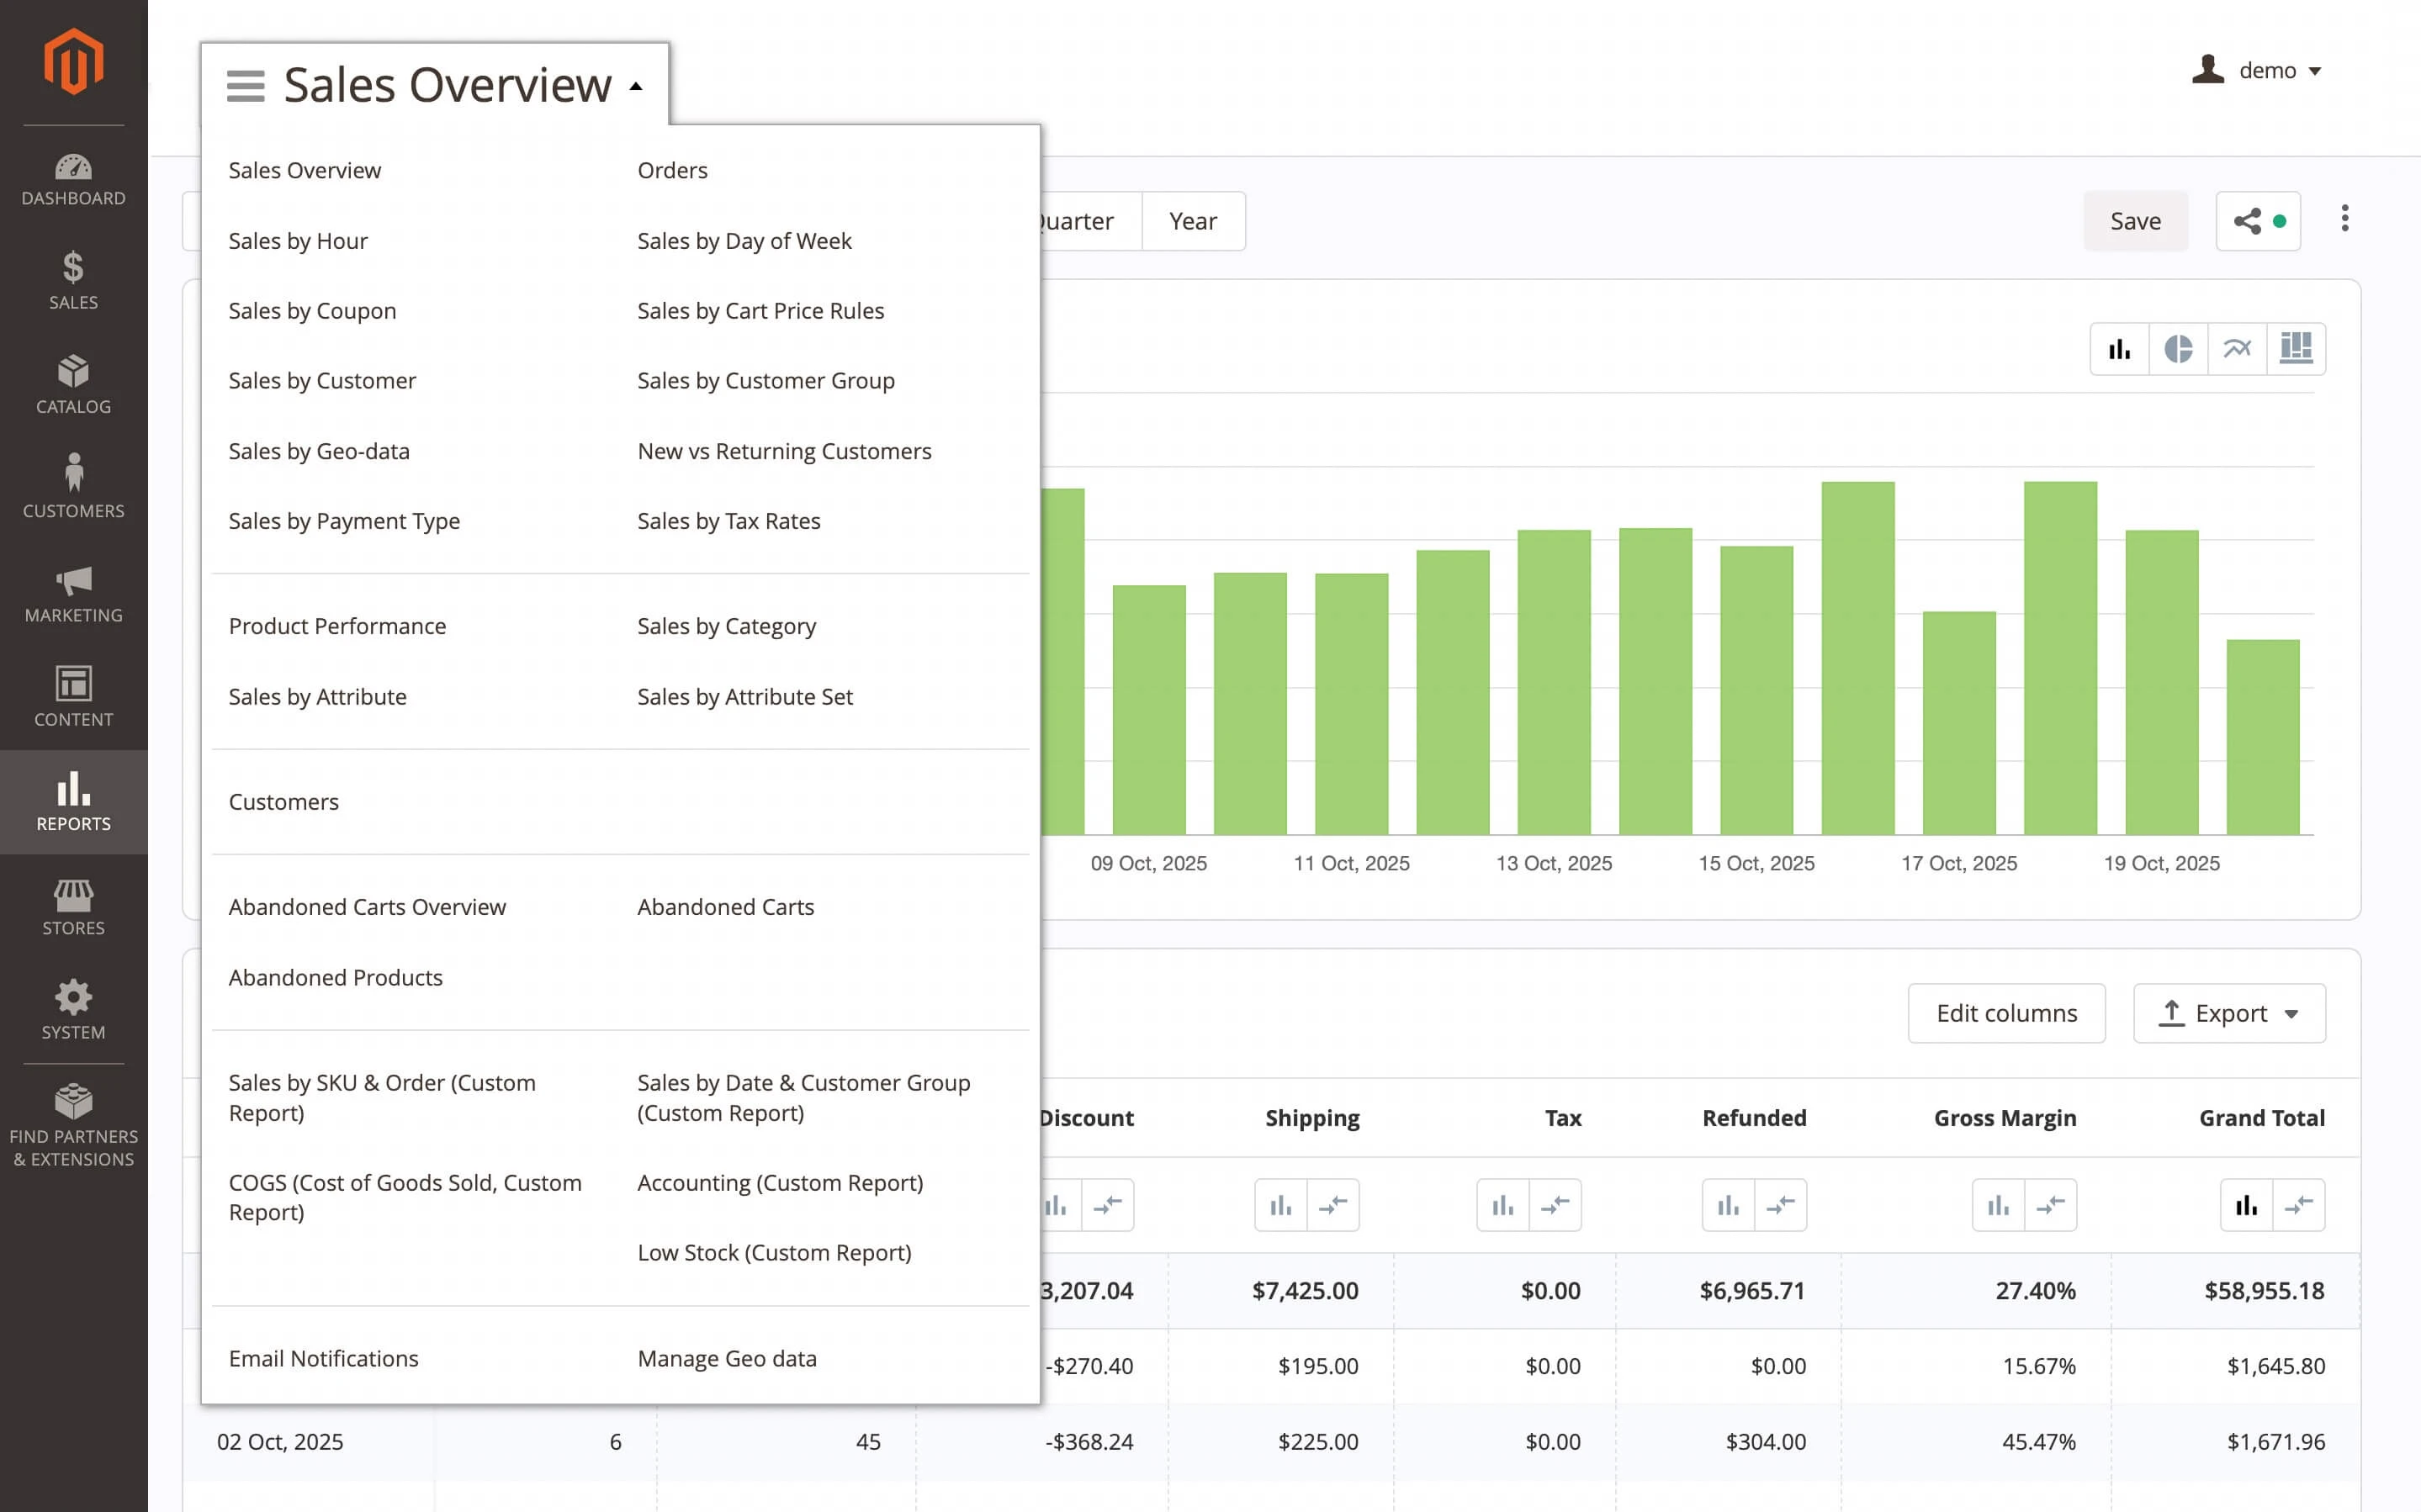
We will start from an existing report and turn it into a reusable view that answers a clear business question. All steps below are performed in the Magento admin under Reports > Advanced Reports. For screenshots and advanced options, see the Advanced Reports manual.
Step 1: Define the question
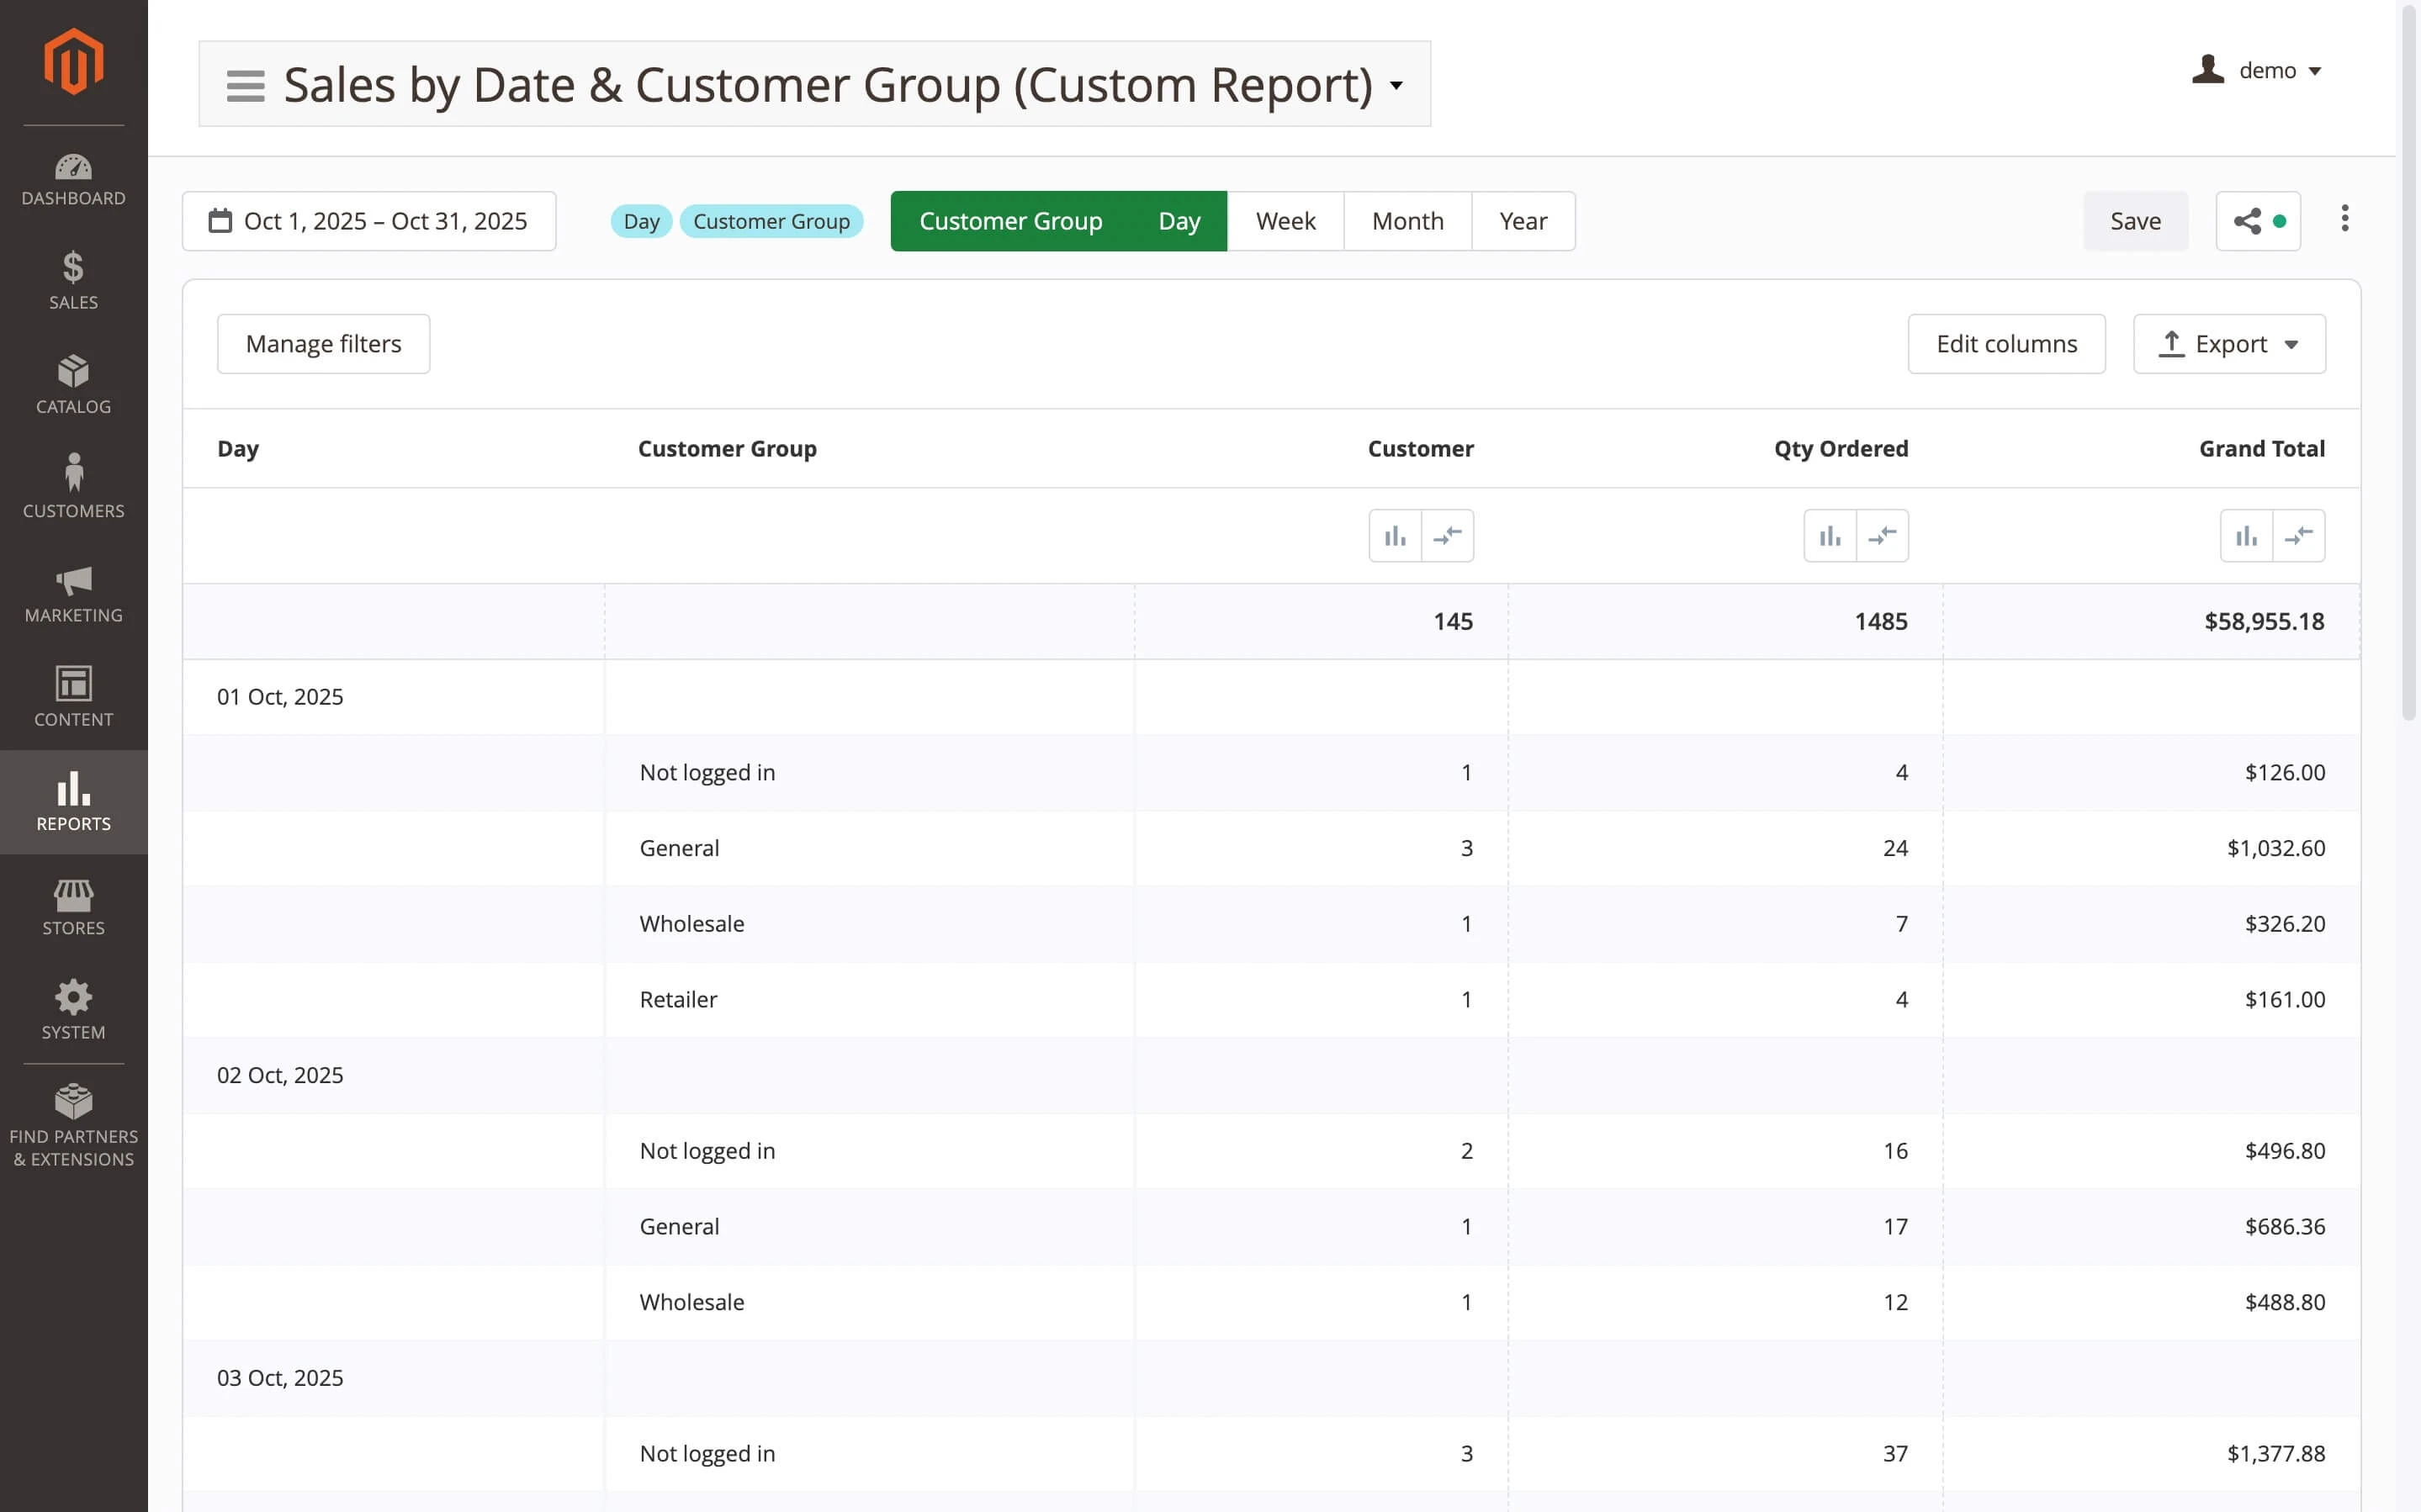
Decide what you need to learn. Examples include monthly sales by customer group or delivery time by carrier. This choice drives the dimensions, columns, and filters you set next.
Step 2: Open a base report and make a copy
Go to Reports > Advanced Reports. Open a report close to your goal, such as Sales by Product. In the toolbar, choose Make a copy to keep the original intact.
Step 3: Enter the Report Builder
In the toolbar, choose Edit report. The builder shows Config on the left and Preview on the right so you can see changes as you work.
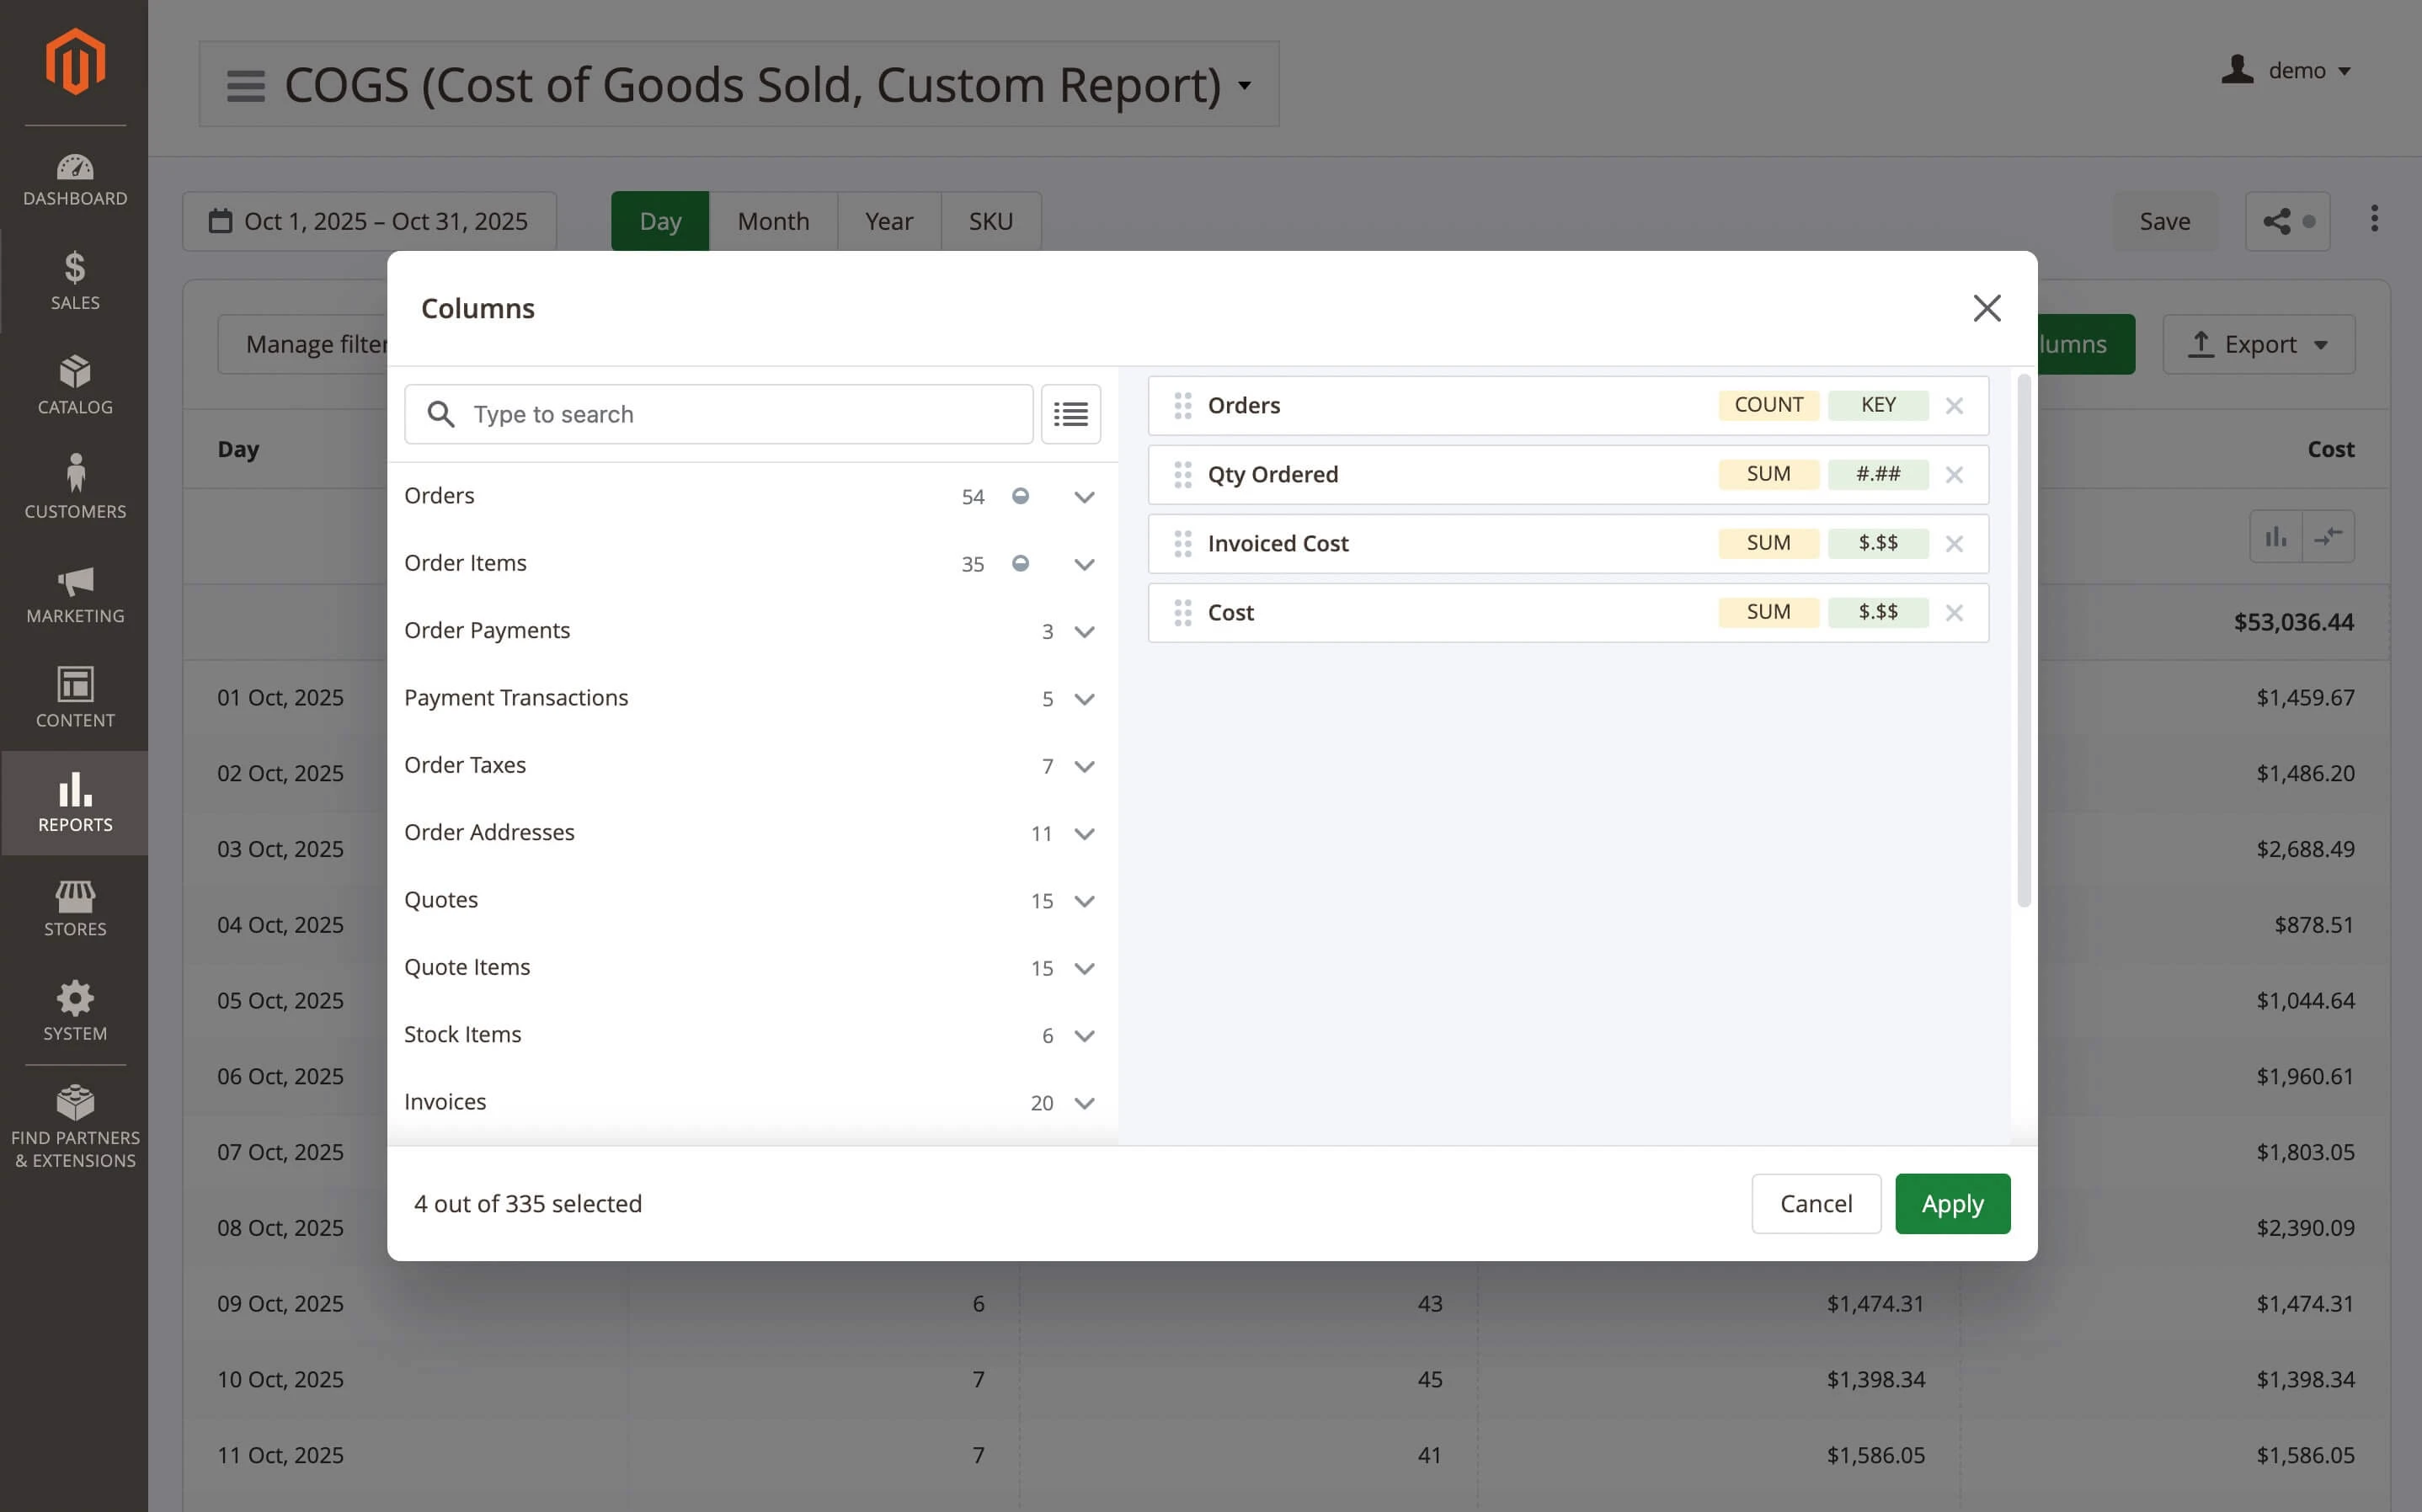
Step 4: Choose dimensions and columns
Go to Config > Table. In the Columns chooser, set a dimension for grouping (Customer Group or Region), then add columns such as Orders, Qty, and Revenue. Reorder fields so the most important numbers appear first.
Step 5: Add filters in the right place
Use Toolbar > Filters for controls that should be visible on the page, such as Date range or Store view. Use Internal Filter for permanent conditions (Order Status = Complete) that should always apply without cluttering the interface.
Step 6: Review the layout, group, and sort
Use Preview to confirm totals and groupings. Sort by a key metric like Total Revenue, and group by the chosen dimension to compare results side by side.
Step 7: Save and name the report
Go to Config > General Information. Enter a clear title, add a short description for the team, and save.
Step 8: Share or schedule delivery
Use Export to download CSV. For regular delivery, open Reports > Advanced Reports > Email notifications and create a schedule. Connect Google Sheets if stakeholders prefer a live spreadsheet that stays updated.
This first report becomes a template for future questions. Duplicate it, adjust fields and filters, and build a small library that matches how your store works.
This walkthrough produced a sales performance view; next, we'll look at other report types you can build with the same flow.
Popular Custom Report Types
Now that you have a working report, let's look at common patterns to build next. Each type below explains what it helps you answer and which fields to include, so you can reuse the same builder flow without starting from scratch.
Delivery Reports
Delivery reports provide detailed information about the progress of order delivery. They are crucial for monitoring and managing the entire delivery process, from order placement to final customer delivery.
This group of reports can be divided into operational and analytical reports. Operational reports include information about orders awaiting delivery, delivered orders, and more. Analytical reports cover metrics such as average delivery time, cancellation or return rates, deliveries by country or city, and so on.
If checkout includes delivery date and time selection via an extension, the report quickly lists orders scheduled for today or tomorrow, with delivery addresses, products, and other relevant details.
Customer Segmentation and RFM Analysis
Every customer is a valuable asset, but they differ in terms of income, order frequency, and more. To allocate marketing resources more efficiently, customer segmentation based on parameters is often used.
By adapting efforts to the specific needs and preferences of identified customer groups, it is possible to increase key metrics such as CLV (customer lifetime value) and AOV (average order value).
To identify different customer groups, an embedded customer report with additional fields such as Customer Lifetime Value (CLV), Order count, and Average Order Value can be utilized.
An extension of this approach is RFM analysis (Recency, Frequency, and Monetary), which significantly enhances the accuracy of customer segmentation. The RFM report in Magento 2 evaluates the customer's last purchase date (R), order placement frequency (F), and total order amount (M).
By combining the values of these three RFM numbers, a summarizing class can be assigned to each customer, allowing for tailored marketing strategies for each segment. This helps optimize marketing efforts and maximize overall efficiency.
Use CLV, order count, AOV, and the RFM class to define segments you can target in remarketing, win-back offers, and VIP benefits.
Financial Reports
Financial reports provide objective information about the business's financial activities, enabling informed decision-making regarding enterprise management.
Financial reports often include information such as Net Revenue, Net Profit, and Margin. Additional columns may cover metrics like Return on Investment (ROI), Customer Acquisition Cost (CAC), Average Transaction Value (ATV), and more.
Agree as a team on how to treat discounts, refunds, and taxes, and apply the same rule in every view to keep trends comparable.
RMA Reports
Return Merchandise Authorization (RMA) reports offer summarized information about return reasons and product conditions. Typically, RMA reports help identify recurring issues, such as product quality, description inaccuracies, delivery problems, and more. Determining which products are returned most frequently aids in better inventory management, helping to avoid low-quality products.
RMA reports may include the following data columns:
- Return Date
- Time to Return
- Order Details
- Reason for Return
- Condition of the Item
- Quantity
- Customer Information
It's worth noting that by default, the Advanced Reports module already includes configuration for many RMA modules, including the native Magento RMA extension.
Track the time to return and the refund rate by product or category to spot patterns that call for clearer photos, tighter QA, or updated copy. For a step-by-step breakdown with examples, read How to Find Issues with Returns in a Magento Store
Inventory Reports
Magento 2 inventory reports provide detailed information on product quantity, movement, and value across the store's warehouses. These reports help identify the need for timely replenishment of inventory, avoid excessive stock on shelves, and optimize the financial resources of the store. They can also be used to forecast demand and ensure the efficient operation of the supply chain.
Include on-hand quantity, reserved, incoming stock, forecast demand, and a reorder threshold, then sort by days of supply to prioritize purchasing.
Abandoned Cart Reports
Abandoned Cart Reports provide information about missed opportunities to sell products. This report analyzes the reasons and frequency of customer refusal to complete purchases, contributing to the improvement of marketing strategies and customer conversion from potential to actual buyers.
The Abandoned Cart Report typically includes: Customer ID, Abandonment Time, Cart Contents, Cart Value, and Promotions/Discounts offered.
Compare abandonment rates by customer group or product category, then test reminders or incentives where the gap is largest.
We've listed the highlights here; for a deeper breakdown of the core types, read Grow Your Business with Magento Reports.
Recent Custom Report Examples
These real-world examples show how the builder answers nonstandard questions by joining extension data and applying custom formulas.
1. Linking orders with subscription data
This custom report displays created orders from the store's customers simultaneously with subscription data for a product identified by its SKU. The data is retrieved from the "subscription_profile" table, which is part of a third-party Recurring Payment Magento extension. Useful when you need one view of orders, subscription status, and the next billing date.
2. Conversion report
Over a specific period, compare orders to abandoned carts and track the ratio over time. Group by date or channel to track funnel health over time.
3. Product pricing report with a link to configurable products
In this report, the store obtains information about prices for simple products that are part of each configurable product. Helps audit price consistency between parent and child SKUs and spot outliers.
4. Channel attribution
This report is built based on a custom field added to checkout (with values stored in the database as JSON). The report lets you group orders by channel and compare conversion across Social, Referral, Email, and Direct, so you can see which sources perform best without extra coding.
Use these as templates and adapt the fields to your data.
Conclusion
By now you have a repeatable way to turn questions into answers. The quickest wins come from building one small report per question, naming and saving it, and putting it on a schedule for the team. Keep definitions for taxes, refunds, and order statuses aligned so numbers match across views.
As your library grows, pair quick built-in checks with Magento 2 custom reports for deeper analysis, cross-table joins, and decision-ready metrics. Review your set each quarter, retire what no one uses, add the fields stakeholders request, and promote the reports that drive action to dashboards or Google Sheets.
If your team works in the admin every day, install an extension and follow the steps above. If you already run a central analytics stack, connect Commerce data there and mirror the same rules. Either path leads to the same outcome: faster decisions, fewer spreadsheets, and a store that learns from its data.
FAQ
What is a custom report in Magento 2?
A custom report in Magento is a saved view you build in the admin to answer a specific business question. You choose the dimension (for example, Customer Group or Region), add the columns you care about, set filters, and optionally apply simple formulas. The result can be reused, shared, and exported.
How do I generate a custom report (with Mirasvit Advanced Reports)?
To generate a custom report with Mirasvit Advanced Reports, go to Reports > Advanced Reports, open a built-in view close to your goal, choose Make a copy, then click Edit report. In Config > Table set a dimension, add columns (Orders, Qty, Revenue), adjust Toolbar > Filters and any Internal Filter, then save and share or export.
Can I create a custom report without coding?
Yes, you can create a custom report without coding. Use an in-admin extension with a visual builder (for example, Mirasvit Advanced Reports) to pick fields, filters, grouping, and basic formulas without SQL. Code is only needed for edge cases such as registering a brand-new table or field.
Where are the built-in reports in Magento 2, and why do they feel limited?
Built-in reports live under Admin > Reports > Sales, Customers, Products. They open fast and use standard definitions, but layouts and fields are fixed, joins with extra tables aren't available, and custom calculations are out of scope. See Adobe's docs for an overview of built-ins on Experience League: Reports in Adobe Commerce/Magento Open Source.
How is Adobe Commerce Advanced Reporting different from custom reporting?
Adobe Commerce Advanced Reporting is a separate cloud service with its own dashboards and data pipeline; it's not the same as building custom views in your store admin. Read more on Experience League: Advanced Reporting.
Can I export a Magento 2 report to Google Sheets automatically?
Automatic delivery to Google Sheets is built into Mirasvit Advanced Reports. Enable Google Sheets sync, link your Google account, choose the destination sheet and tab, then schedule the refresh (for example, daily) under Reports > Advanced Reports > Email notifications. The data will update on that cadence; use Export if you also need a one-off CSV/XLSX/PDF file.
Writer
Magento 2 Reports Extension gives you 20 ready-to-use reports, a custom report builder, and multiple dashboards - everything Magento's default reports leave out.
Install Magento 2 Advanced Reports and take your online store's analytics to the next level!
Keep Learning