How Core Web Vitals May 2021 Will Impact Your Website
-
 Eugen Barilyuk
- SEO
- Apr 5, 2021
- 18 min read
Google is preparing to revamp its search ranking with a big algorithm overhaul. Starting in May, 2021 on top of the current four user experience ranking criteria in place, three more will be introduced, known as the Core Web Vitals. These new critieria measure the quality of the user experience on a website and will have wide-reaching impact.
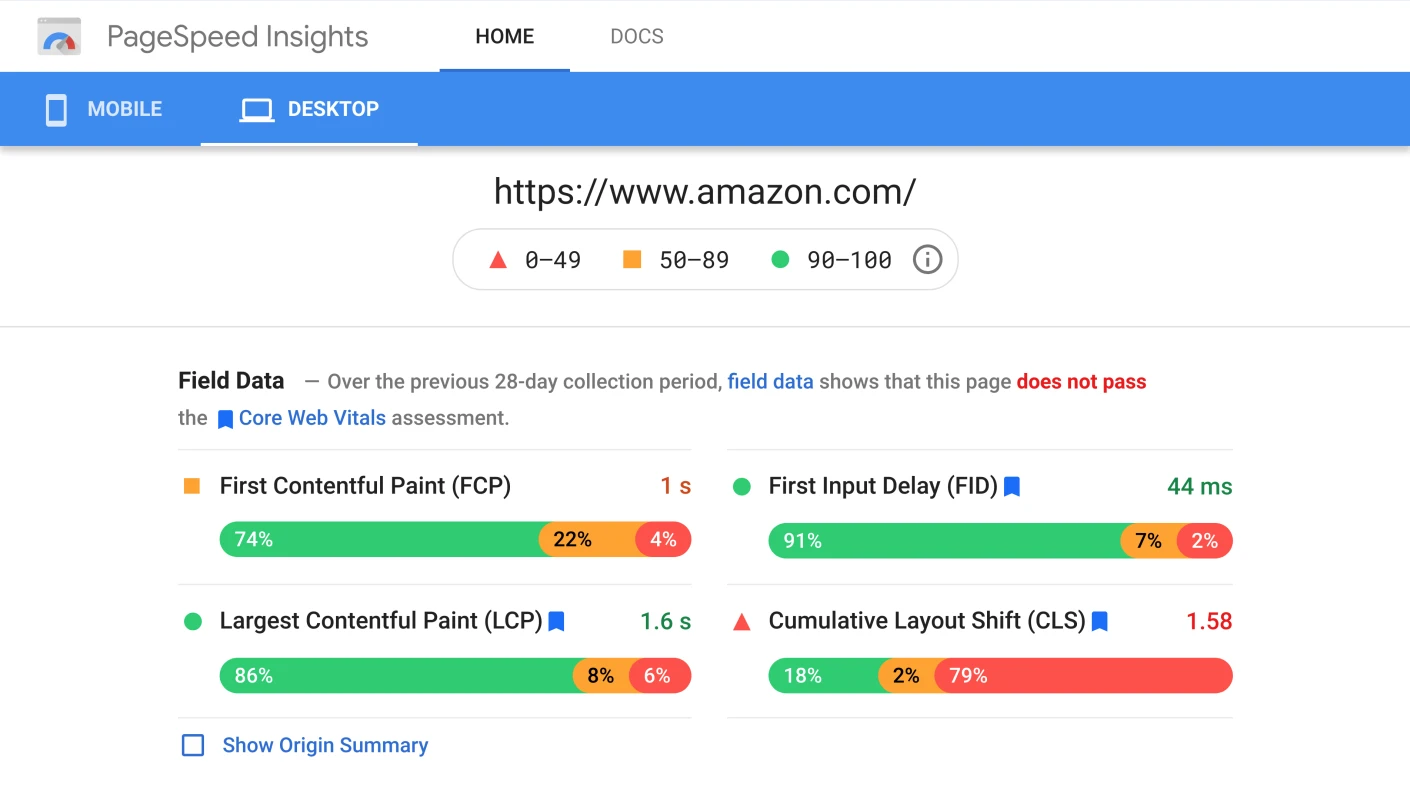
Even if your shop’s current Google metrics are above 90 points and none of the Google PageSpeed check points are red, it still has a high probability of failing Core Web Vitals.
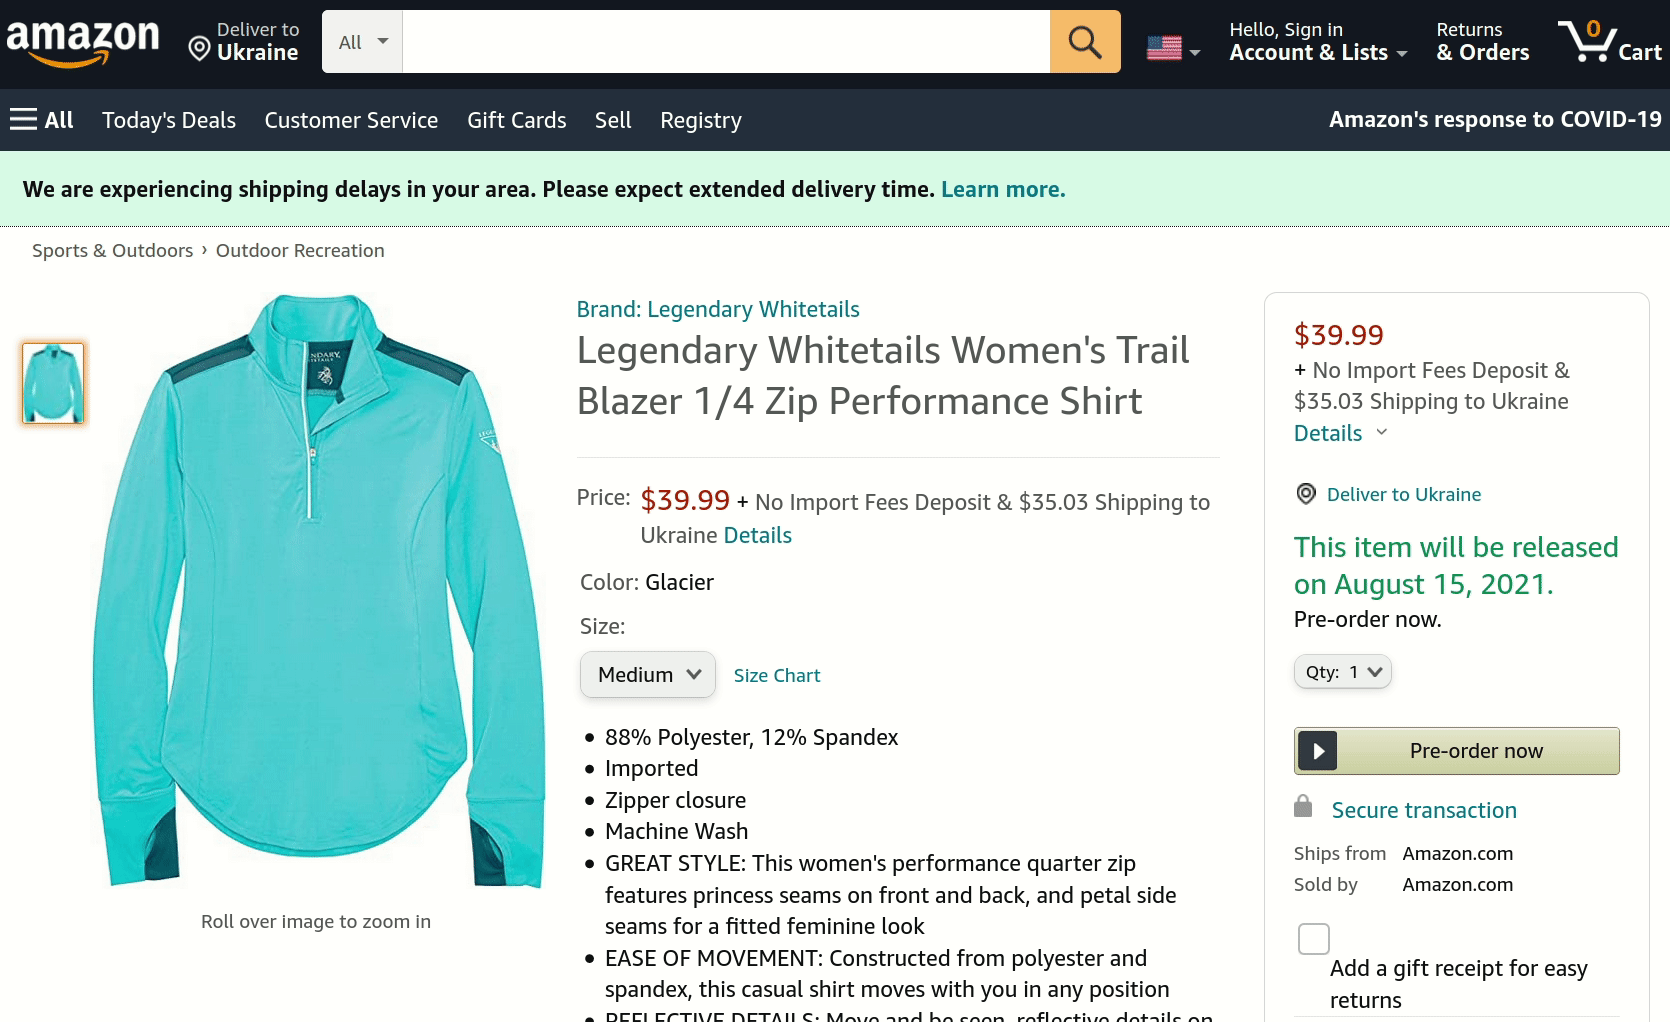
In fact, only 13% of eCommerce websites pass the Core Web Vitals. Even one of the largest global eshops – Amazon – fails to deliver this metric both on mobile:
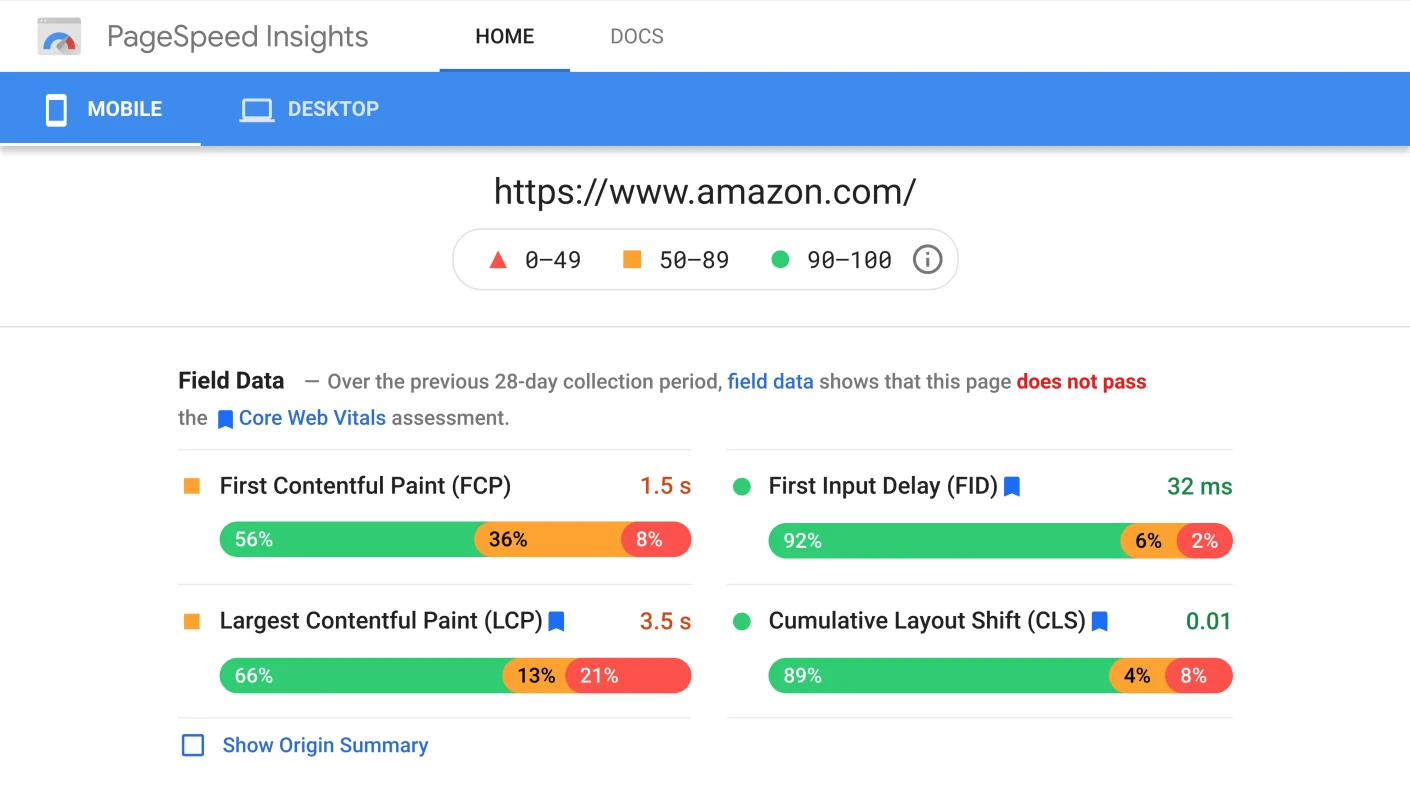
and on desktop:
The updated Google algorithms go beyond simply measuring page speed. They directly look at the user’s experience and their interaction with the web-page. The most popular websites will be ranked higher in the search results.
You need to be able to audit your Core Web Vitals and adapt your store to new criteria.
Here’s what you’ll learn in this article:
How to measure web-page’s Core Web Vitals
How to adapt your store to Core Web Vitals
What is Core Web Vitals?
Core Web Vitals is a set of metrics that Google uses to measure a website’s user experience. These criteria assess speed, responsiveness, and visual stability in addition to already existing page metrics.
Each of the Core Web Vitals metrics represents a distinct facet of the user experience. Over time, the metrics that make up Core Web Vitals will evolve.
Currently, the set focuses on three aspects of the user experience – loading, interactivity, and visual stability. These are measured with the following metrics (picture source – Google):
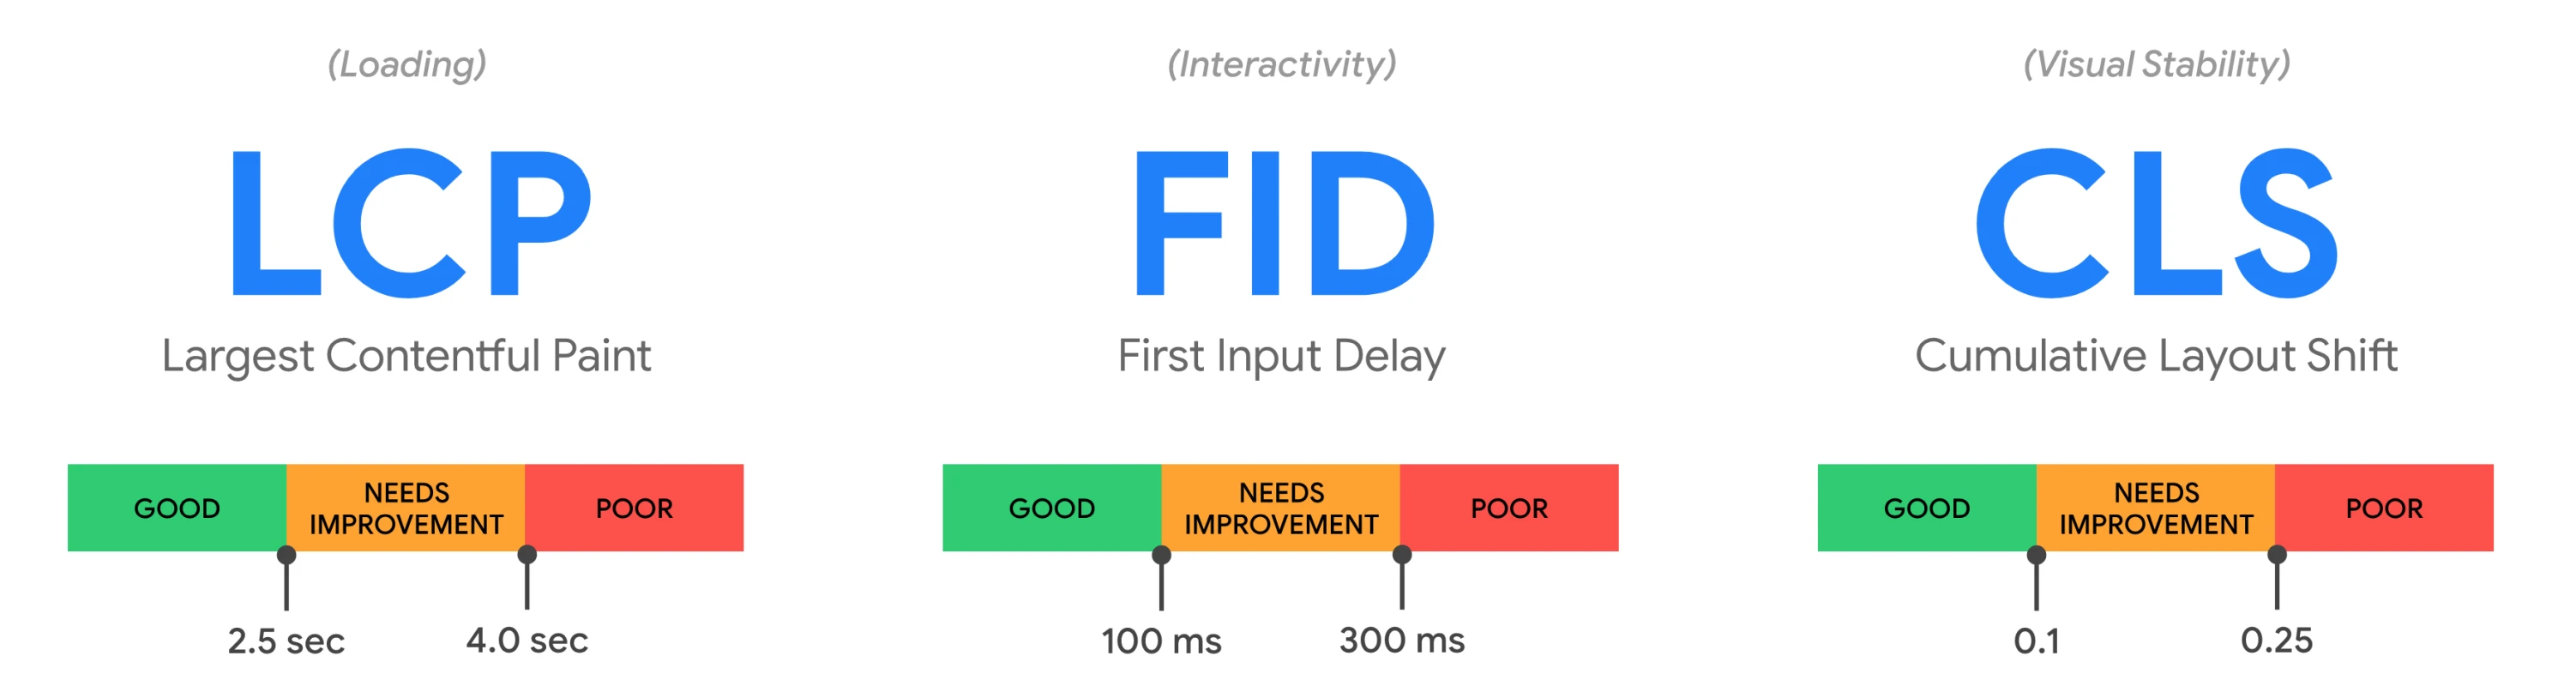
For all three metrics, the results are based on 75% of the visits to a URL, segmented across mobile and desktop users.
Largest Contentful Paint
This metric monitors the time it takes to load the largest set of content onto an analyzed web-page. That can be an image, video, a large block of text, or other content. The page is considered fully loaded when the largest set of content is loaded.
In simple words, Largest Contentful Paint (LCP) shows the time it takes for your user to see the majority of a page’s content after clicking on its link.
Prior to the release of Web Core Vitals, the closest metric for measuring content loading time was First Contentful Paint. But this metric gauges only the loading time of the initial DOM content to render. It does not capture how long it takes to render the largest and usually more meaningful content on the page.
To get a high LCP score and provide a good user experience, the measurement of LCP should fall below 2.5 seconds counting from the moment the page starts loading. Time under 4 seconds indicates room for improvement, and time above that is considered a poor result.
First Input Delay
With this metric, Core Web Vitals measures interactivity of each webpage, in essentially the time it takes for a user to be able to engage with a page after he or she first clicks on the page’s link.
First Input Delay (FID) metric is influenced by the following time frames:
the time required for choosing an option from the menu
how long it takes to enter information into a given field
the time period needed for a user to click on a site’s navigation link.
The FID metric is especially important for websites that require an input of login details or the collection of other user data.
This metric also is crucial to online shops since they have lots of interactions with users. For example, a customer visits the page of a particular item they wish to buy. The page seems fully loaded, however when they click on the button for adding the item to the cart, this buton takes a noticeably long time to load.
To obtain a high FID score in Core Web Vitals, a page should have an interactivity time that is less than 100 milliseconds. The page's FID needs improvement if it is below 300 ms. Above that threshold is considered a poor result.
Cumulative Layout Shift
Using this metric, Google measures the visual stability of the page. It measures the time for all present elements on the page to fully load so that when the user interacts with the page, it doesn’t shift on the screen.
Cumulative Layout Shift (CLS) can be hard to understand, but you’ve definitely experienced it. Remember when you opened a webpage, started scrolling through it and its content began to jump up and down. That was a layout shift, which leads to a terrible user experience.
Layout shift can be a real problem for an ecommerce shop. The user can encounter jumping buttons when they think a page is fully loaded. This often leads them to accidentally press the wrong button. For instance, instead of adding one more item to their cart, they end up clicking on the cancel button.
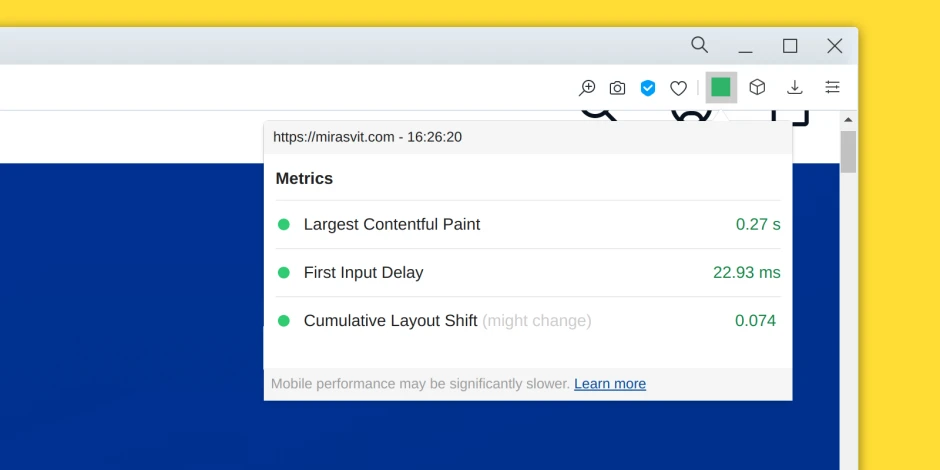
Here is an example of the Amazon page with a layout shift around 0.27 on desktop:
To provide a good user experience, pages should maintain a CLS of less than 0.1. They need improvement if they register below 0.25 and a poor result is anything above that.
The layout shift score calculation begins with the evaluation of the area which is affected by the shift. From there, this area is multiplied by the largest dimension of a viewport. The latter is basically the height of the browser window.
The CLS algorithm will not penalize pages for animations caused by a user interaction. For that, the CLS algorithm skips recording the layout shift during the first 500 ms after a user clicks, types, taps, or makes other actions on a page.
How to measure web-page’s Core Web Vitals
Google considers Core Web Vitals critical to all web experiences so these metrics will be available in all of its popular online tools. The data on all three metrics will be available via five tools: Chrome User Experience Report, PageSpeed Insights, Search Console, web-vitals JavaScript library, Chrome extension.
Search Console
Site owners can easily look at the Core Web Vitals metrics in the Search Console.
The report helps evaluate pages across an entire web-site. It uses data from real users to identify pages that can be improved. The user data is supplied by the Chrome User Experience report
Chrome User Experience Report
It is possible to directly check a Chrome User Experience report (known as CrUX) on available Core Web Vitals data.
The CrUX is a public dataset with experience from opt-in users on millions of websites. To use it, first get an API key by creating one on the Google Cloud Platform credentials page.
Then run the command with replaced API_KEY for your generated key and specified URL for origin.
curl https://chromeuxreport.googleapis.com/v1/records:queryRecord?key=API_KEY \
  --header 'Content-Type: application/json'   --data '{"origin":"https://example.com/"}'
Here is an example for checking Core Web Vitals on a real webpage:
curl https://chromeuxreport.googleapis.com/v1/records:queryRecord?key=AIzaSyA2XQLpd8DVRWVtjhY9XjdFlDJqgSuUn88 \
  --header 'Content-Type: application/json'   --data '{"origin":"https://www.nytimes.com"}'
In the console output, you’ll get a JSON object:
{
  "record": {
    "key": {
      "origin": "https://www.nytimes.com"
    },
    "metrics": {
      "cumulative_layout_shift": {
        "histogram": [
          {
            "start": "0.00",
            "end": "0.10",
            "density": 0.54090818163632814
          },
          {
            "start": "0.10",
            "end": "0.25",
            "density": 0.23634726945389115
          },
          {
            "start": "0.25",
            "density": 0.22274454890978296
          }
        ],
        "percentiles": {
          "p75": "0.22"
        }
      },
      "first_contentful_paint": {
        "histogram": [
          {
            "start": 0,
            "end": 1000,
            "density": 0.57288644322161342
          },
          {
            "start": 1000,
            "end": 3000,
            "density": 0.36228114057028671
          },
          {
            "start": 3000,
            "density": 0.064832416208104468
          }
        ],
        "percentiles": {
          "p75": 1559
        }
      },
      "first_input_delay": {
        "histogram": [
          {
            "start": 0,
            "end": 100,
            "density": 0.8843190233163184
          },
          {
            "start": 100,
            "end": 300,
            "density": 0.049234464124887266
          },
          {
            "start": 300,
            "density": 0.066446512558790652
          }
        ],
        "percentiles": {
          "p75": 16
        }
      },
      "largest_contentful_paint": {
        "histogram": [
          {
            "start": 0,
            "end": 2500,
            "density": 0.78689344672336015
          },
          {
            "start": 2500,
            "end": 4000,
            "density": 0.12416208104051998
          },
          {
            "start": 4000,
            "density": 0.088944472236118843
          }
        ],
        "percentiles": {
          "p75": 2290
        }
      }
    }
  },
  "urlNormalizationDetails": {
    "originalUrl": "https://www.nytimes.com/",
    "normalizedUrl": "https://www.nytimes.com"
  }
}
This JSON object consists of metrics that are expressed in a histogram. It represents the percent of users that experienced a metric with that value proportionally to all users.
In the output above, Cumulative Layout Shift metric has a "start": "0.00" and "end": "0.10" with "density": 0.54. This means that for 54% of the page, visitors values of this metric were between 0 and 0.10.
Be especially aware that when using this report, a specified URL will be omitted if it doesn’t meet the minimal data volume requirement for reporting.
PageSpeed
Getting Core Web Vitals data through the Google PageSpeed Insights is quite likely the easiest way. Simply specify the URL for the page you wish to check and wait several seconds for the task to be completed.
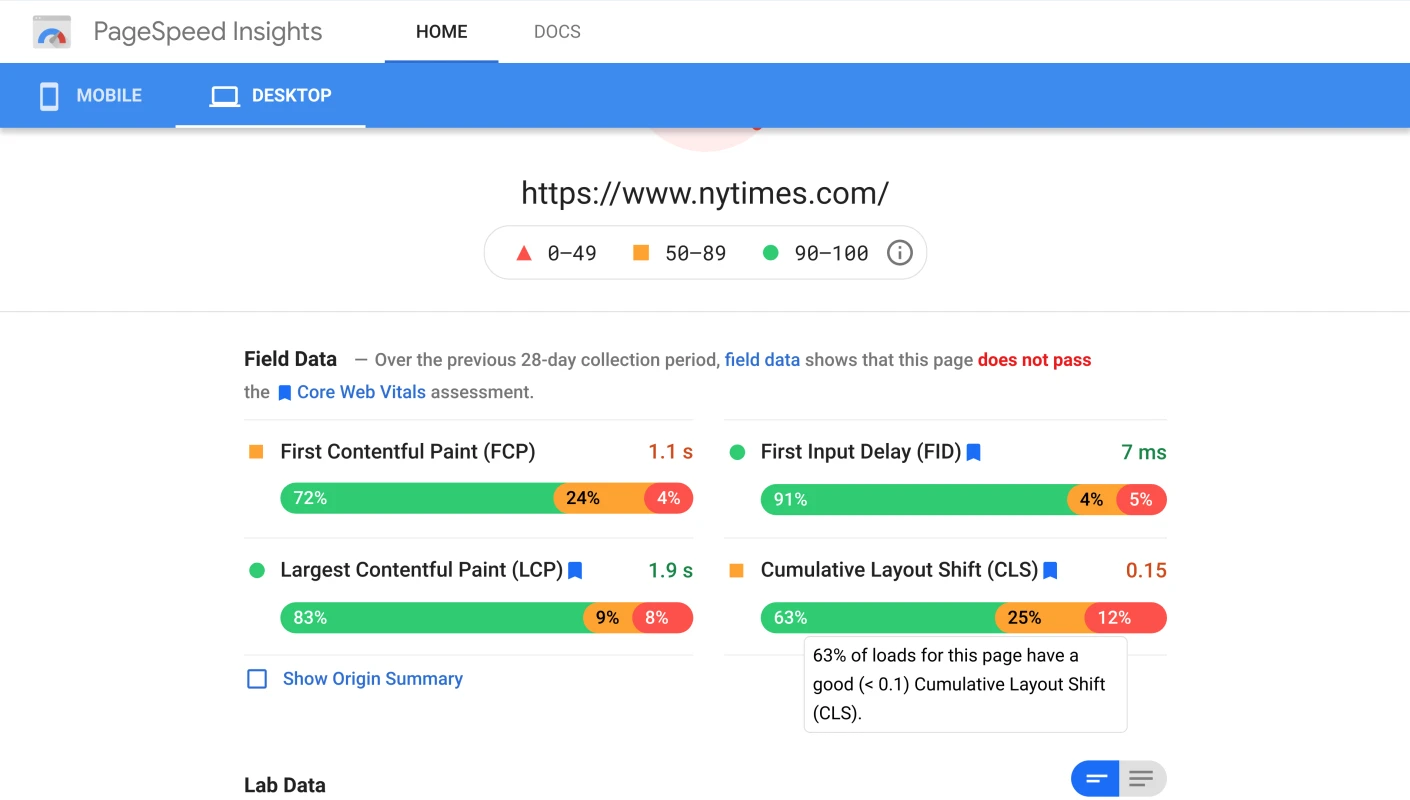
The Core Web Vitals verdict is shown in the color green when a page passes, and in red when it fails. Below the verdict containing detailed statistics for LCP, FID and CLS is shown.
JavaScript
Collecting Web Vitals measurements is also possible using JavaScript library web-vitals. It is a small (~1KB) library that provides an API for each of the Web Vitals metrics.
You can install the web-vitals library locally or load it via a content delivery network (CDN). In the latter case, just add the code below to the web-page that you want to check Core Web Vitals for:
<script type="module">
  import {getCLS, getFID, getLCP} from 'https://unpkg.com/web-vitals?module';
  getCLS(console.log);
  getFID(console.log);
  getLCP(console.log);
</script>
When adding the code to the web page, open the page in the web browser, and inspect it via Developer Tools. On the Console tab, select Console Settings and activate the Preserve Log option.
Refresh the webpage and interact with it so that the Core Web Vitals metrics become visible in the browser’s console:
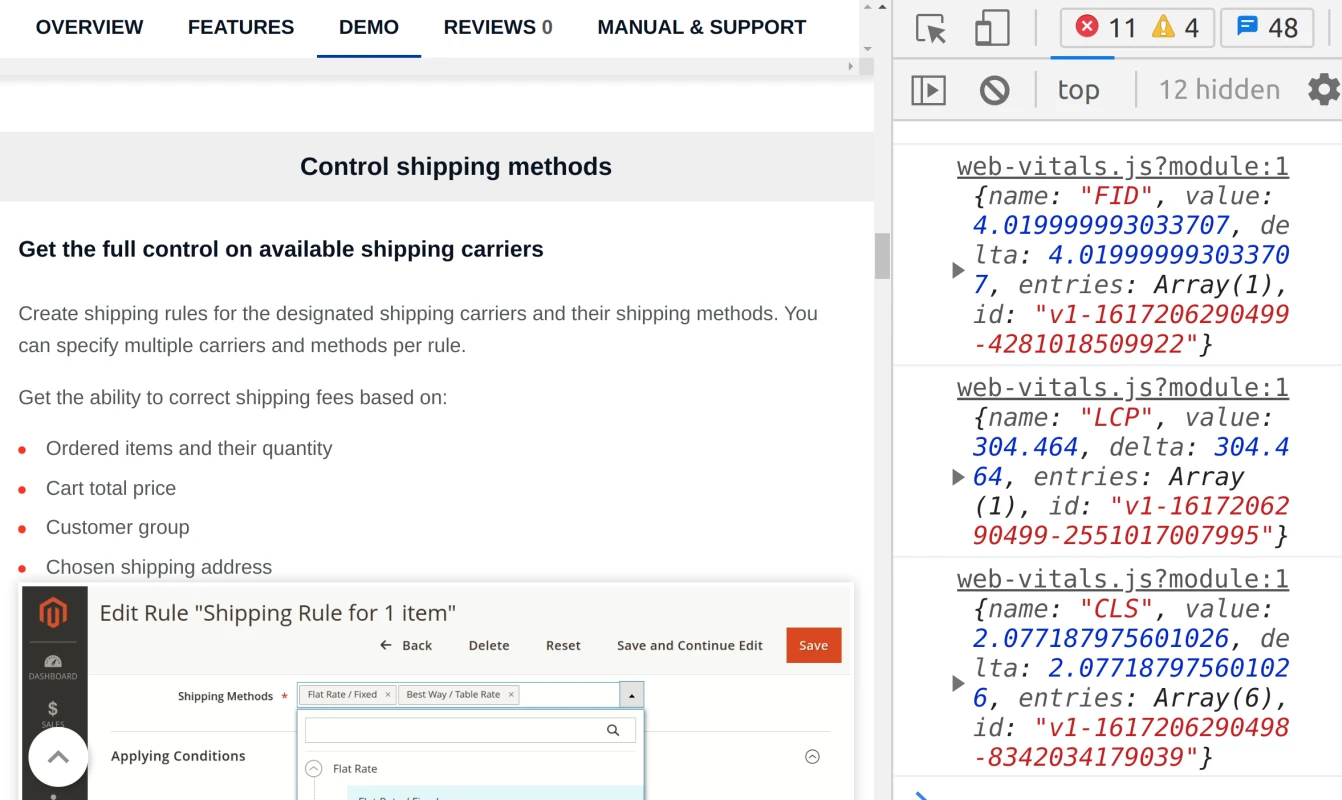
The obtained data can be sent to Google Analytics or another analytics endpoint.
Chrome extension
Reporting on Core Web Vitals is also possible without writing any code. This can be done via the Web Vitals Chrome Extension.
This extension uses the web-vitals JavaScript library for measuring the metrics of a given webpage from the current user’s viewpoint.
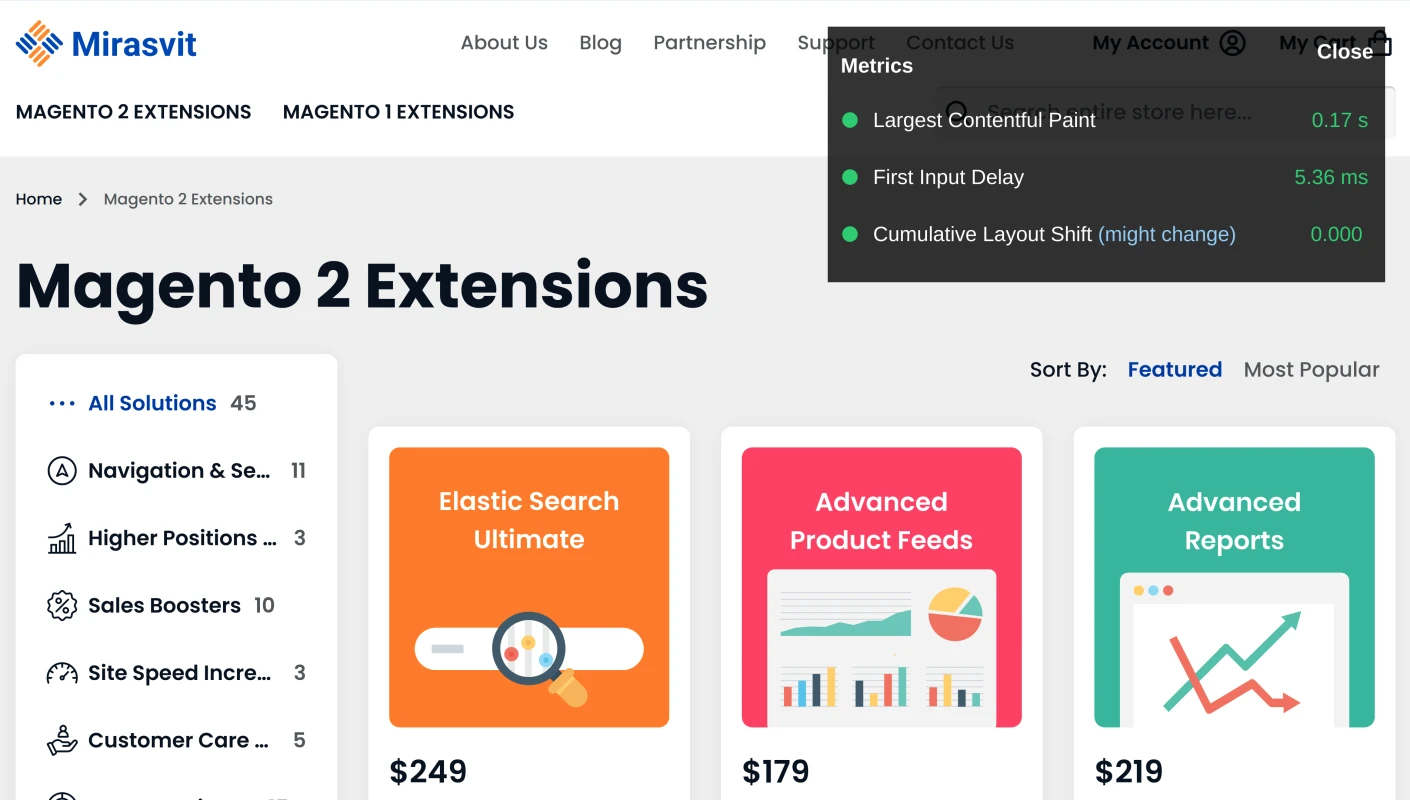
Displayed data can change while the user is browsing the page. For example, when the user changes the page scale, it causes page elements to shift. The extension will increase the displayed value of the Cumulative Layout Shift metric.
How to adapt your store to Core Web Vitals
Once you have obtained data on Core Web Vitals for your website, you can take actions to address the highlighted problems.
Since Core Web Vitals are measured with the data obtained from real users, you won’t see the immediate improvement. You’ll have to wait until Google gets enough feedback to reevaluate the results - it typically takes about 28 days.
Optimize Large Contentful Paint
Ensuring that the Largest Contentful Paint metric is lower than 2.5 seconds can require identical actions at when optimizing for page loading speed. You can read about page speed improvement in-depth in the article Boost your site speed applying Google PageSpeed Insights suggestions.
For a Magento store, you can use the extension Google PageSpeed Optimizer that covers certain paths to LCP optimization.
Here are the most frequently cited reasons behind low LCP metric and propositions on how you can mitigate them:
Slow server response times
A browser cannot render content if the data wasn’t received from the server. This means that a slow server response directly hits the LCP. To improve it, you can try optimizing the server, using a Content Delivery Network (CDN), caching assets and serving cached HTML pages first, or connecting to third-party servers on early stage of page load.
Establish third-party connections early
Server requests to third-party origins can have a great impact on the LCP, especially when such resources are used to displaying critical content. It is better to connect to them as soon as possible when the page starts loading.
To establish an early connection, use the prefix rel="preconnect", so that the link to the third-party origin will appear as follows:
<link rel="preconnect" href="https://example.com"/>
You can easily establish network connections early with the PageSpeed Optimizer module using its Preload Recourses option. It allows you to insert paths to third-party origins with the "preconnect::" prefix.
DNS service is another third-party origin, so if you wish to establish an early DNS lookup, you can use the prefix dns-prefetch. Consider using it for browsers that do not support preconnect.
Render blocking JavaScript and CSS
External stylesheets (<link rel="CSS.css">) and JavaScript (<script src="script.js">) make the browser pause while parsing HTML until it finishes loading those resources.
The solution is to defer non-critical JavaScript and CSS and move such resources to page bottom.
In Magento, you automatically move JavaScript to the page bottom with the Google PageSpeed Optimizer module. In its configuration menu, open JavaScript Optimizations and activate Move JavaScript To Page Bottom. For the identical action on CSS, use the option Move CSS To The Page Bottom.
To ensure that page render is blocked only with the minimal amount of necessary JavaScript and CSS, use options Minify CSS and Minify JavaScript.
Slow resource load times
Other types of web resources can also affect the time required for content to be rendered on screen. These are images, videos, inline-level text elements and others.
To optimize their effect on LCP, you can compress images and other files, preload such resources, cache assets, and deliver assets based on a given user’s internet connection speed. Also, you shcould consider using an image CDN.
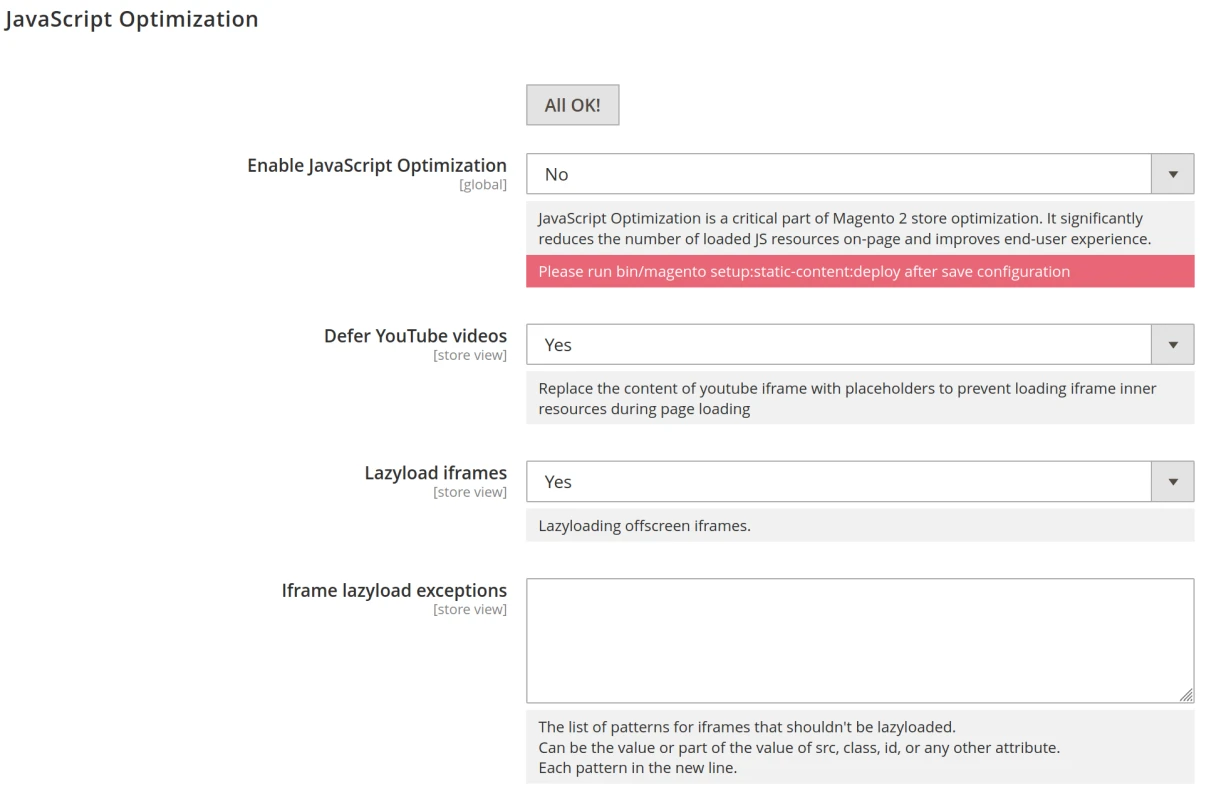
The PageSpeed Optimizer module offers some optimizations on this issue. Use the options Defer Google Fonts, Defer YouTube videos and Lazyload iframes to further reduce the page loading delay by loading those components precisely when they are needed.
For image optimization, specifically use the option Image Quality level to lower the image file size. When possible, activate the option Use WebP images to start using it in your Magento store modern image format, as it offers an improved compression rate. Additionaly, you should activate the option Image Lazy Load.
Client-side rendering
Often sites render the page in the user’s browser via client-side JavaScript. A large Javascript bundle can significantly affect the LCP score since users may not be able to view and interact with the page until the critical JavaScript finishes executing.
The mitigation for this issue can be achieved with minimization of the critical JavaScript code, moving to server-side rendering, using pre-rendering.
The minimization of critical JavaScript code can be done by minifying JavaScript, deferring unused JavaScript, minimizing unused polyfills.
Server-side rendering allows you to render the application into HTML, which is displayed at the beginning of a page render. Then client-side JavaScript can continue to incorporate the required data onto the same DOM content.
But a server-side rendering comes with its own drawbacks. It is harder to build and maintain such a web application, it increases server response time, and it can increase the amount of time required for the page to become interactive.
Pre-rendering is a technique which involves a browser without a user interface. It generates static HTML files of every route and these files are sent to the user.
Read more on server-side rendering in Magento in the blog post.
Optimize First Input Delay
This metric captures how quickly user can start interacting with a page in a meaningful way. It cannot be simulated with programmatical tools and requires a real user interaction. However, you can make an educated guess on a FID score by looking at the Total Blocking Time (TBT) metric.
Heavy JavaScript execution
The main cause of a poor FID is heavy JavaScript execution. You can reduce FID by optimizing JavaScript parsing, compilation, and execution.
To improve this, try to break up long tasks, reduce JavaScript execution time, optimize your page for interaction readiness, and use a web worker.
First try to reduce the amount of JavaScript on a web-page. If the FID results are not close enough to expected then it is necessary to break up long tasks into smaller, which can be asynchronous.
A JavaScript is considered a long task if it blocks the main thread for 50 ms or more. Often this happens when JavaScript loads more than a user may need at a given moment.
Interaction readiness optimization
For further page interaction readiness optimization, it may be helpful to use progressive loading of code and features. Server-side rendered pages may also require shifting more logic execution to server or generating more content statically.
Users are also able to interact with the page earlier when non-essential scripts are moved to the page bottom.
The FID score can be impacted by cascading data-fetching, during which JavaScripts and other components cannot proceed with execution. Aim to minimize the cascading data fetches, and the amount of client-side processed data.
Third-party script execution
Analytics, tags and other third party scripts can keep the page unavailable for interaction with users. Try to defer loading and execution of such components until they are actually required by the user. You can also try to give more priority for loading content-critical components.
Use a web worker
The main thread is a virtual place where the browser processes most of the page load related tasks. This thread is responsible for handling layouts, parsing CSS and HTML, building the Document Object Model (DOM), and executing JavaScript.
If the main thread gets bogged down with a single task, it is unable to execute other tasks, becoming unresponsive to user interactions.
One possible solution is to to run JavaScript on a background thread instead of the main thread. This can be achieved with web workers. To use web workers on your site, you may need a third-party library like Comlink, Workway, Workerize.
Optimize Cumulative Layout Shift
Elements on the page should not move unexpectedly for the user. This relates to any layout shift on the page that occurs after the initial 500 milliseconds after the last user input. Keeping the Cumulative Layout Shift of the page under the score of 0.25 is good, but if it is under 0.1, that's much better.
The most frequent causes of a high CLS value are images, ads, embeds, iframes without dimensions, dynamically injected content, usage of web fonts that cause FOIT/FOUT effects, and waiting for a network response before updating DOM.
Media without dimensions
To avoid content jumping because the browser doesn’t know how much space the image or video will require, always use the width and height size attributes:
<img src="image.jpg" width="1024" height="768" alt="image on page" />
Alternatively, you can reserve the space for such elements with CSS aspect ratio boxes.
Using CSS for resizing is not the best option since the exact required space on the screen can only be determined when the element begins to download. In this case, specify width, height, and CSS aspect ratio for the element size, so that the browser can reserve the required space in advance.
For responsive images, use the attribute srcset to specify the sizes of each image in the set. Each image should use the same aspect ratio so it will be possible to set width and height attributes.
Ads, embeds, iframes
Ads can be considered as one of the most prominent reasons for layout shifts emergence. They can push visible content down the page:

Follow best practices to reduce ad-caused layout shift by statically reserving most likely slot size for the ad, and avoid collapsing of this space when no ad is returned. Aim not to place ads near the top of the viewport.
The same is equally true to other embedded elements on the page, including iframes. These can be YouTube videos, views of Google Maps, social media posts, etc.
Dynamic content
Dynamic content can shift the page layout similarly to embedded content. These are usually banners and forms like a proposition to sign-up for a newsletter, app installation, GDPR notice, etc.
When such dynamic content is required to display, reserve the sufficient slot size in the viewport in advance, for example, using a placeholder. Also avoid inserting new content above pre-existing content.
Web fonts that cause FOUT/FOIT
Web fonts are not always available when they are required and that can cause a layout shift. This shift can happen in two ways:
flash of unstyled text (FOUT) – when the fallback font is swapped with a new web font
flash of invisible text (FOIT) – when invisible text is displayed until a new web font is rendered
Minimize the layout shifting caused by the web fonts using the attribute font-display in a CSS. Combine it with font preloading using the attribute <link rel=preload>.
Animations
Aim to use CSS transform animations that don’t trigger layout changes on the page.
Summary
Organic search is one of the best ways to bring qualified traffic to your site so you should aim to get high ranking in the search engines. With the introduction of Core Web Vitals, Google is making an attempt to round out the metrics of the user experience, serving as an obstacle for poor and underperforming websites which keeps them from getting a higher ranking.
Starting in May, Google will begin to determine the page ranking based not only on the relevance but also on how well the page performs to the user. Pages that provide better user experience will be ranked higher.
Core Web Vitals will not be the only ranking factor, as Google will continue to use metrics that measure other parameters of the user experience, like mobile-friendly, safe browsing, HTTPS, and no intrusive interstitials.
Still, Core Web Vitals can become a major ranking factor. A study conducted by Google over millions of page impressions showed users are at least 24% less likely to abandon a page before it finishes loading on the site that passes Core Web Vitals.
The sooner you adapt your site to Core Web Vitals, the better the chance of preserving or improving your organic search traffic.
Lastly, remember this: metrics are goals, not minimum requirements. Don’t sacrifice tools that help you to convert page visitors into customers.
Writer