
How to Improve Your Google PageSpeed Insights Score in Magento 2
-
 Eugen Barilyuk
- Magento 2
- Updated: Jul 20, 2026
- 21 min read
Refreshed for 2026: added Core Web Vitals (LCP, INP, CLS), real before-and-after numbers from our own store and client sites, and the latest Google PageSpeed Optimizer settings.

When someone opens your store, they've got little patience for waiting. More than half of visits are abandoned if a page takes more than 3 seconds to load, and those visitors rarely come back to buy.
Speed has been a Google ranking factor since 2010 on desktop, and since 2018 on mobile. And it pays off directly: in Portent's 2022 study of over 100 million pageviews, e-commerce sites that loaded in 1 second converted at 3.05%, against just 0.67% for sites that took 5 seconds – roughly 4.5 times better.
Google's free PageSpeed Insights test shows you exactly what is slowing a page down. This guide walks through every suggestion it can throw at a Magento 2 store, what each one means, and how to fix it, with real before-and-after numbers from our own site and client stores.
Here's what you'll learn:
- What PageSpeed Insights actually measures
- Core Web Vitals: LCP, INP, and CLS
- What results can you realistically expect?
- Where to start: the highest-impact fixes
- Every PageSpeed Insights suggestion, explained
- Final thoughts
What PageSpeed Insights actually measures
PageSpeed Insights is a free online tool that shows how fast your site runs. Paste the link to any page you want to check, wait a few seconds, and you'll get results.
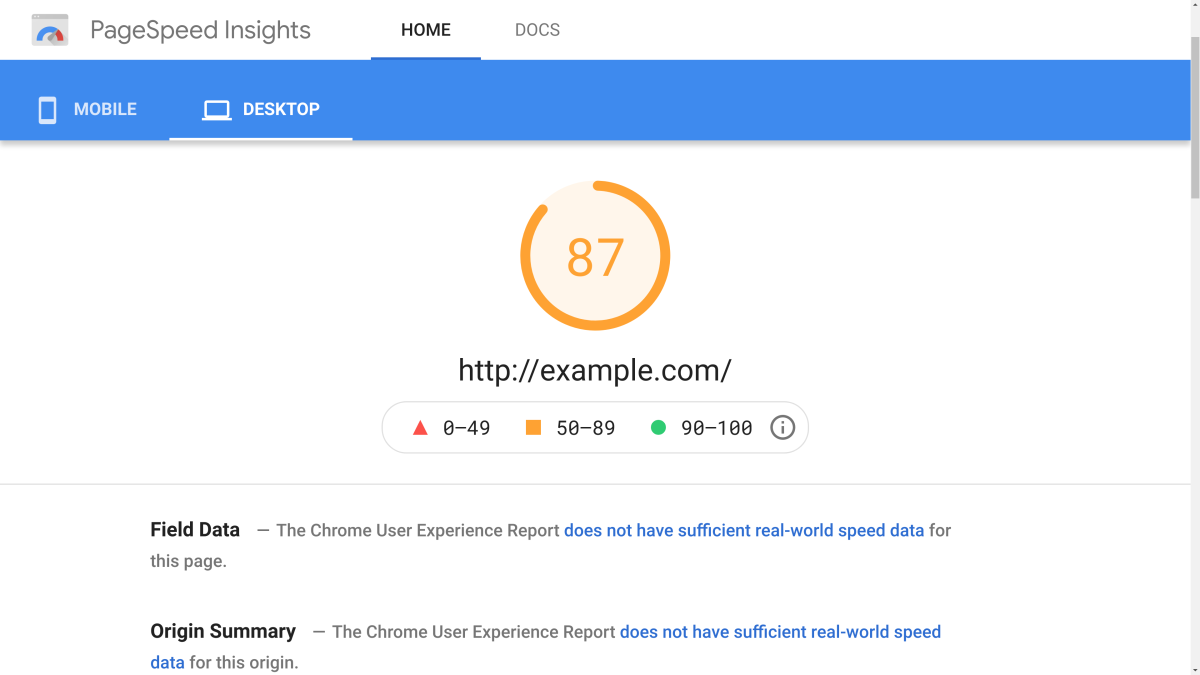
The test scores both the desktop and mobile versions of a page. Google treats mobile as the more important of the two, because of the increasing share of smartphone traffic.
Here's the same Magento store as viewed on desktop:
and on mobile:
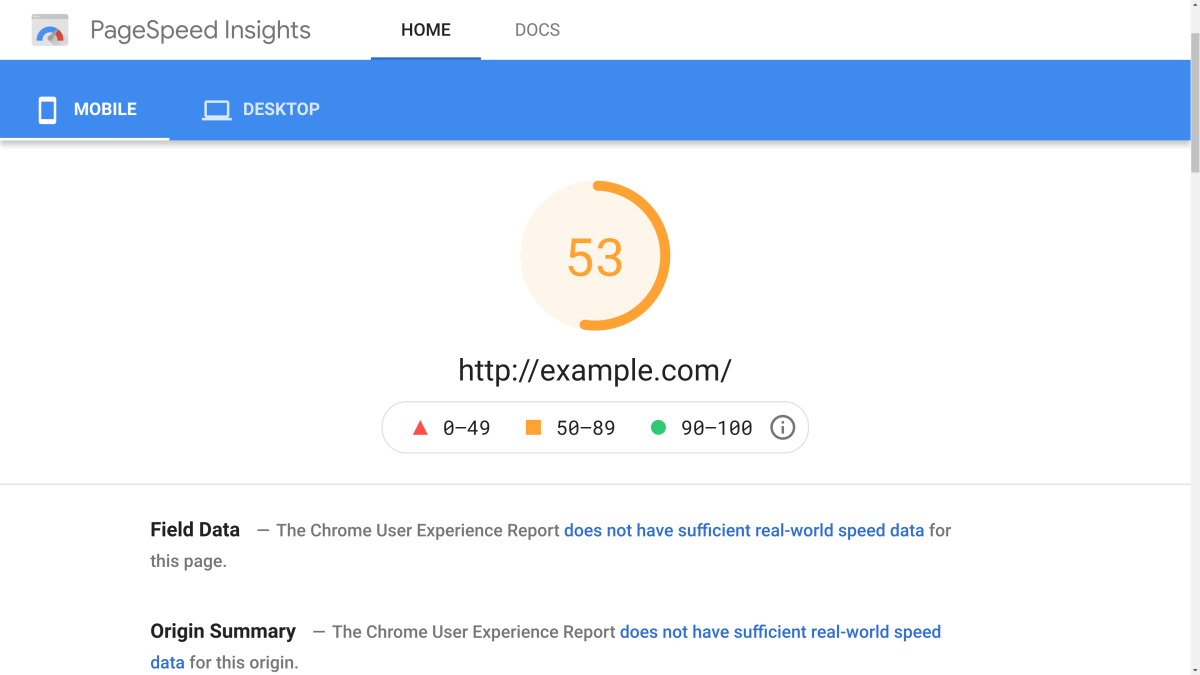
The overall score is color-coded:
| Color | Score | Meaning |
|---|---|---|
| Green | 90-100 | Good |
| Orange | 50-89 | Needs improvement |
| Red | 0-49 | Poor |
A score above 90 puts you in roughly the top 5% of performant websites.
A typical Magento installation doesn't score high in PageSpeed Insights, especially on mobile. You can read the exact values in our previous article. The good news: with the tweaks in this guide, you can push both scores up a lot.
Core Web Vitals: LCP, INP, and CLS
Here's something most older guides miss. PageSpeed Insights no longer leads with a single lab score. At the top of the report it now shows field data: how real Chrome users actually experienced your page over the last 28 days, pulled from the Chrome User Experience Report (CrUX). The Lighthouse "Opportunities" you'll fix below sit underneath that.
The field data is organized around three Core Web Vitals:
- LCP (Largest Contentful Paint): loading. How long until the biggest element (usually your hero image or headline) renders. Aim for 2.5 seconds or less.
- INP (Interaction to Next Paint): responsiveness. How quickly the page reacts to clicks and taps. Aim for 200 milliseconds or less.
- CLS (Cumulative Layout Shift): visual stability. How much the layout jumps around while loading. Aim for 0.1 or less.
If you optimized for FID (First Input Delay), note that it's gone: INP replaced FID as a Core Web Vital in March 2024, and it's a stricter test. It measures every interaction, not just the first one.
Two things worth knowing from our own work. First, lab data (the Lighthouse score) and field data (CrUX) don't always agree. A page can score well in the lab and still feel slow to real users. Second, we don't chase CrUX numbers directly when we set up a store; we tune against PageSpeed Insights and watch the field data follow. Cutting heavy JavaScript off the main thread (which the merge step below does) is what tends to move INP most.
The module's newer options map straight onto these metrics. Delay JavaScript Until User Interaction holds heavy third-party scripts (Google Tag Manager, chat, analytics) until a shopper actually interacts, which takes load off the main thread and helps INP. Critical CSS per page type and automatic preloading of the main product image both target LCP by getting the visible part of the page to render sooner.
For a deeper look at each metric, see our guide to Core Web Vitals.
What results can you realistically expect?
Before you spend a weekend on this, a dose of honesty: how much you can lift a score depends on where you start and why it's low.
Two rules of thumb from years of doing this:
- The lower your current score, the easier the big jump. Going from 20 to 70 is far more realistic than squeezing 80 to 85.
- Your theme, your server, and what the page actually renders set the ceiling. No amount of tweaking beats a bad foundation.
That last point matters because there are really two different levers, and it's easy to confuse them:
- Your theme is an architectural lever. On our own site, mirasvit.com, we spent years iterating on PageSpeed metrics and got stuck around 70 desktop / 50 mobile on the Luma theme. And worse, the site genuinely felt slow. Then we moved to the Hyvä theme without changing the design, and landed at 90+ desktop / 80-90 mobile with no further optimization at all.
- An optimization module is a pointwise lever: many small, targeted fixes. On a client store still running Luma, our Google PageSpeed Optimizer took the score from 30 to 90 on desktop and 15 to 60 on mobile, at default settings. We just switched it on; it gathered some statistics, ran its optimizations, and the rest happened on its own.
Don't mix the two up. Hyvä is a change of approach; the module is a set of targeted improvements on top of whatever theme you run. (For a plain-English breakdown of what the module is and how it works, see our companion post.)
Does your theme matter? Luma vs Hyvä
Yes - more than any single option. Hyvä was a big shift in how Magento themes are built, and it gave the whole platform a second wind. It's also far simpler to reason about, which matters now that so much code is written with AI assistance. If you're starting a rebuild anyway, Hyvä is the single biggest speed decision you'll make.
But Hyvä doesn't make an optimization module redundant. Even on Hyvä, the module still earns its place:
- Images: lazy loading, compression, next-gen formats, and resizing.
- Monitoring: scheduled PageSpeed Insights measurements so you can watch scores drift over time.
- Other small but necessary optimizations.
Where to start: the highest-impact fixes
If you run a Luma-based theme, the core problem is almost always the number and size of resources: JavaScript and CSS. If a page needs 30 small JS files to work, loading all of them is slow. One larger file beats many tiny ones.
There's a catch, though: merge everything into a single file and it becomes huge, most of which a given page never uses. So the module builds one file per page type, including only what that page actually needs. That's the option to start with.
In the module interface, that's:
- Enable JavaScript Optimization
- Merge JavaScript files
This isn't a dumb merge – it's a smart, per-page-type merge. The other options matter too, but they're genuinely pointwise from here.
One honest caveat: merging can break layouts, from either CSS or JS. The usual symptom is a page that renders incorrectly for a moment during load and then settles: that visible "jump." The module ships with a default ignore list of known-problematic files, and you can add your own. And a simple discipline pays off: enable one option at a time and re-test, so you know exactly what moved the needle, or what broke.
Every PageSpeed Insights suggestion, explained
After it evaluates a page, PageSpeed Insights gives you Opportunities and Diagnostics: concrete suggestions for loading the page faster. They range from reducing third-party code, to cutting JavaScript execution time, to serving static assets with an efficient cache policy, to shipping properly sized images. The list differs between desktop:
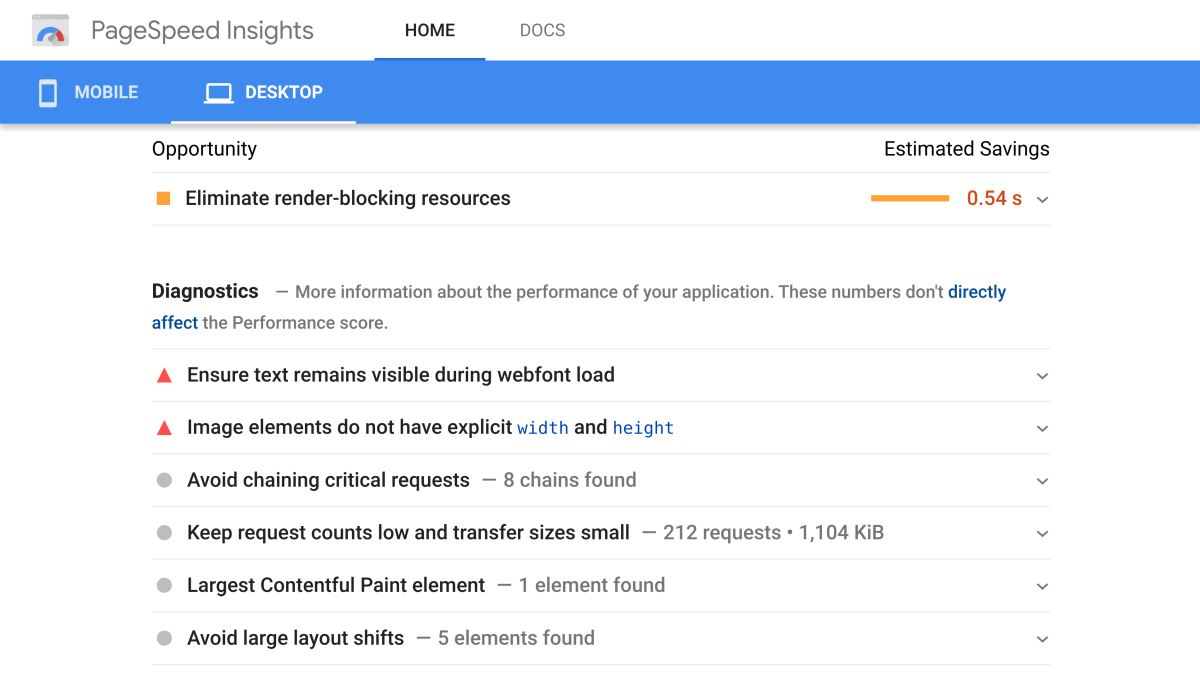
and mobile:
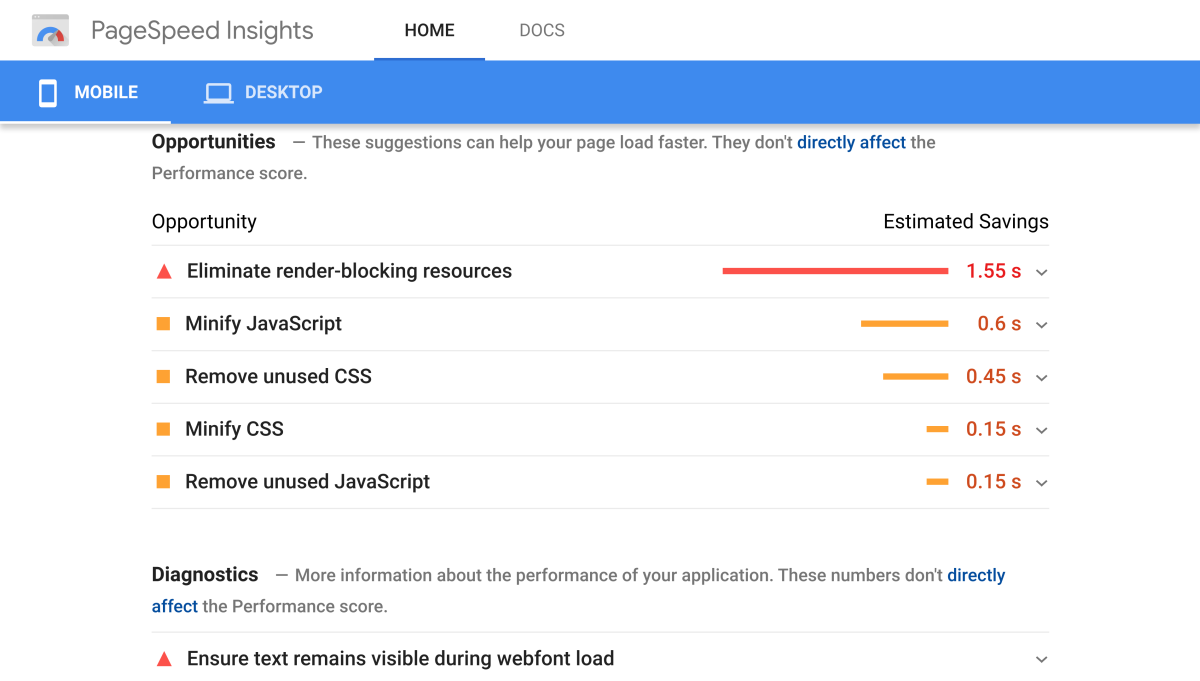
Here's what each suggestion means and how to resolve it.
1. Eliminate render-blocking resources
This means CSS, JavaScript, and fonts load before the page renders. When the browser hits a render-blocking resource, it stops downloading the rest of the page and puts rendering on hold.
The browser treats every resource in the <head> section as render-blocking: CSS, JavaScript, fonts, media files. Move those resources to the bottom of the <body>, and the browser no longer treats them as render-blocking.
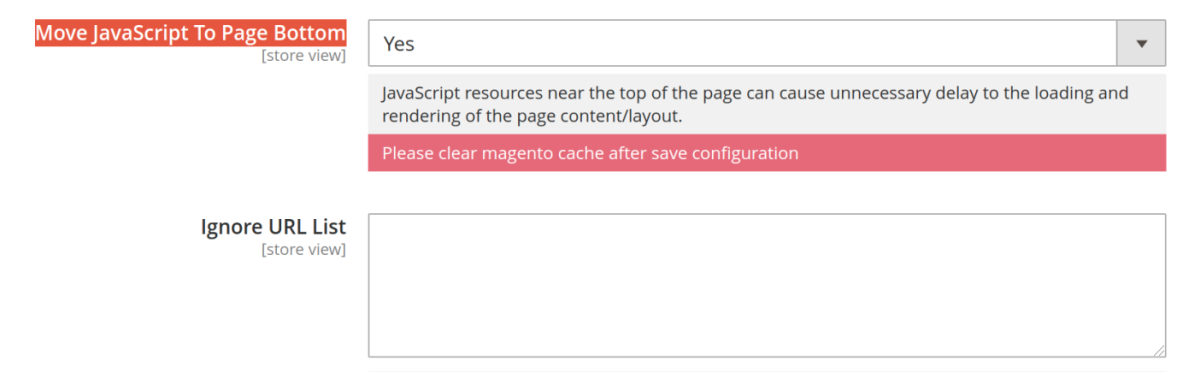
So the fix is to move such components to the bottom of the page. You can do it automatically with the module: open JavaScript Optimizations and turn on Move JavaScript To Page Bottom. If some scripts must load before the rest of the content, add them to the Ignore URL List.
2. Reduce JavaScript execution time
This means the JavaScript on the page takes too long to run during load. Badly timed or long-running JavaScript is a common cause of performance problems, and profiling it is something of an art, since the source code is nothing like the code that actually executes.
You can reduce execution time by:
- moving long-running JavaScript off the main thread to Web Workers
- using micro-tasks to spread DOM changes over several frames
- using browser devtools to assess the impact of each script
- adding timeouts manually, tuned experimentally to the code's complexity
- removing unused code: ship only what's needed right now
- minifying and compressing your code
- caching your code
That list is hard to implement, so a simpler partial fix is to move JavaScript to the bottom of the page. In the module, use Move JavaScript To Page Bottom. It defers execution without affecting how the page is built.
3. Remove unused JavaScript
JavaScript files usually count as render-blocking, since they stop the browser from continuing to load. Shipping unused JavaScript hits load speed hard.
There are two kinds of unnecessary JavaScript: dead and non-critical. Dead JavaScript is never used on the page. Non-critical JavaScript isn't needed for above-the-fold content but still runs somewhere (for example, code triggered by a custom action).
Analyze your site's JavaScript by hand to optimize it through code-splitting and removing what you don't need. As a partial fix, the module's Move JavaScript To Page Bottom option helps here too.
4. Remove unused CSS
You'll see this when PageSpeed Insights finds style sheets with unused CSS worth 2 KiB or more. Removing it cuts unnecessary network activity.
Fixing it properly takes real effort: split the styles into parts and load only what a given page needs. As a quicker partial fix, use the module's Move CSS To The Page Bottom option.
If certain CSS shouldn't move to the bottom (styles that affect how the page displays), make an exception with Do Not Move CSS That Contains. Reach for it when the page content jumps while loading, or when something displays differently after you enable Move CSS To Page Bottom.
A more surgical approach is Critical CSS per page type: the module extracts the above-the-fold styles each page type actually needs, inlines them, and defers the rest with Defer Non-Critical CSS. That way the first paint isn't blocked while the full stylesheet loads, which is exactly what LCP rewards.
5. Minify JavaScript
Minification removes data that doesn't affect how the browser processes the code: comments, formatting, unused code, long variable and function names, and so on. They make code easier for humans to read, but browsers don't need them.
Minifying JavaScript shrinks file size, cuts network activity, and loads pages faster.
With the module, minify JavaScript by turning on Minify JavaScript in the JavaScript Optimizations menu.
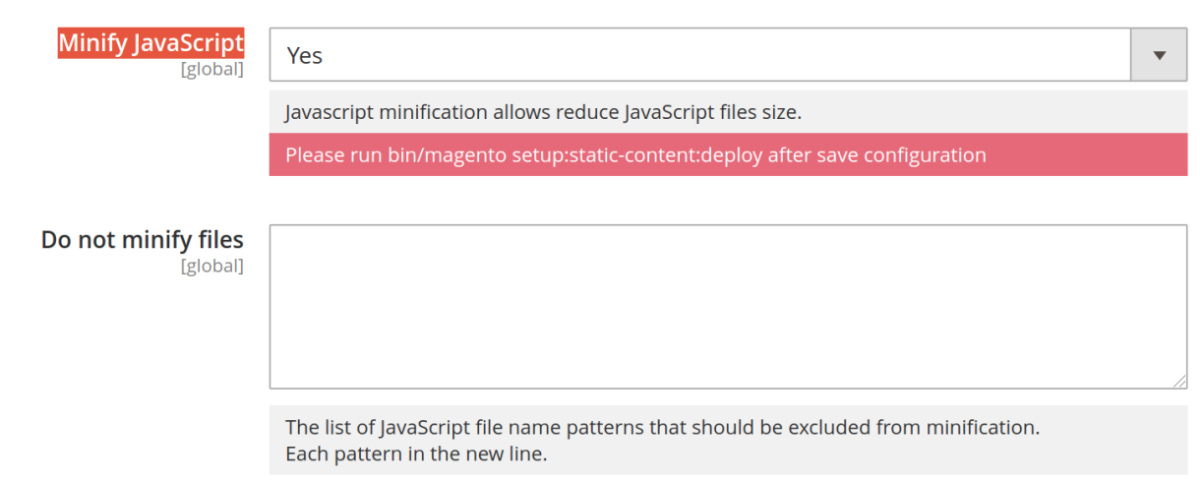
Not every file can be minified automatically, so if errors appear after you enable it, use Do Not Minify Files to exclude the problematic ones. (You can only identify a file when Merge JavaScript files is disabled.)
Merge JavaScript files shrinks size further. On different stores it affects the rating differently, so test with the option off and on and pick what works for your case.
6. Minify CSS
Minify CSS files too, for the same reasons. This takes well-formed, readable CSS and strips the spacing, indentation, newlines, and comments, none of which a browser needs.
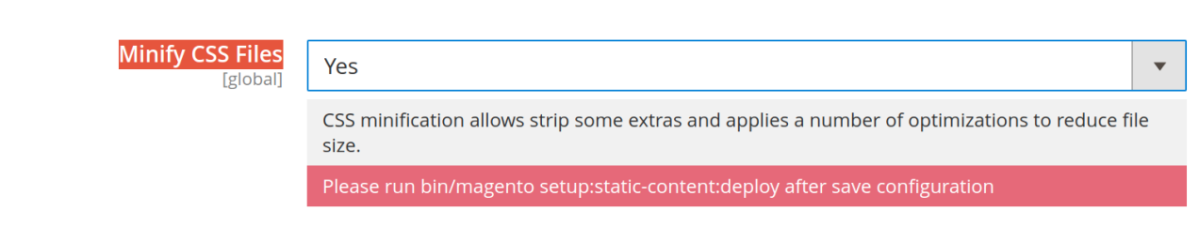
In the module, turn on Minify CSS Files in the CSS Optimization section.
7. Ensure text remains visible during webfont load
This diagnostic means webfonts are slowing your page load. Webfonts let a site show the same typeface to every visitor, even those without the font installed.
Webfonts are set up in CSS, so to clear this diagnostic, add a rule that forces the browser to render with the system default font until the webfont loads, then swaps them. You can also preload webfonts.
Sites often use Google's webfonts. In the module, address a webfont-load problem with Defer Google Fonts in the CSS Optimization section. You can also try Preload resources in the HTML Optimization section, which preloads third-party elements.
8. Minimize main-thread work
The main thread is where the browser handles most of the work of loading a page: layout, parsing CSS and HTML, building the Document Object Model (DOM), and executing JavaScript.
When a single task bogs the main thread down, it can't run anything else, creating a bottleneck. While the main thread is busy, your page may not respond to user interactions, a bad experience.
There's no single fix for this one. It calls for work across several categories:
- Script Evaluation: the time spent running JavaScript. Partial fix: Minify JavaScript and Move JavaScript To Page Bottom. You can also edit the code to postpone less important scripts.
- Style & Layout: the time to build the page in the browser. Improve it with Minify CSS files, Move CSS To Page Bottom, Remove Unused CSS, and Minify HTML.
- Rendering: similar to Style & Layout, and so is its solution.
- Garbage collection: the memory the browser uses. Fixing it means tedious work like refactoring JS and reducing the number of variables. Low priority, so it's often more productive to skip it.
- Script Parsing & Compilation: the time to process and execute JS. Reduce the amount of code; the same measures as Script Evaluation apply.
- Parse HTML & CSS: also about the time to build the page. To improve it, avoid an excessive DOM size and reduce the number of CSS styles.
9. Efficiently encode images
This means the images on your site should be compressed further. Users can barely tell 100% quality from 80% or 70%, but they'll feel the faster load. Google recommends a compression level of 85 or lower.
Compress images by hand before uploading, or install an image-optimization plugin that does it on upload.
With the module, use the Image Optimization section: find Image Quality level and pick the level you want from the drop-down.

10. Properly size images
Sometimes images load not only at excessive quality but at excessive resolution. If the image rendered on screen is smaller than the source, you've wasted network activity and the page takes longer to load.
PageSpeed Insights compares the rendered size against the source size. If the rendered size is at least 4 KiB smaller, you'll see Properly Size Images.
The main strategy is "responsive images": generate multiple versions of each image and specify which to use where, say, the main article image versus its thumbnail. Install a responsive-images plugin, or use an image CDN that serves appropriately sized images.
For icons and similar elements, vector formats like SVG are better: tiny file size, and they scale to any dimension.
The module has a Responsive images section, so you don't need extra software. Before generating images, add a configuration that specifies the desired image width on desktop and mobile.
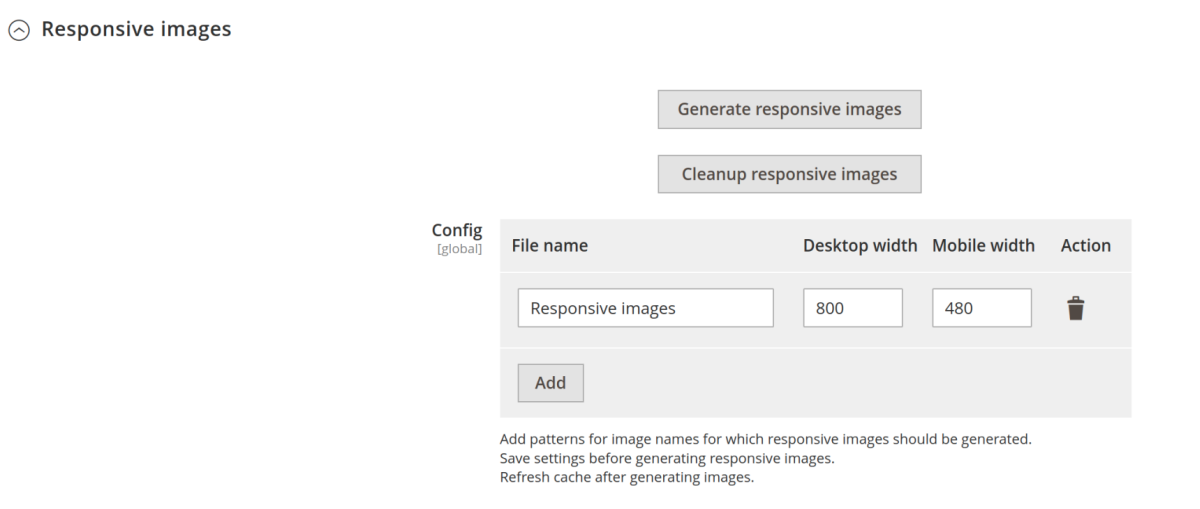
If you've generated responsive images before, delete the previous files first with the Cleanup responsive images button.
11. Serve images in next-gen formats
Old image formats like JPEG and PNG can be much larger than a modern WebP, or the newer AVIF, which usually compresses even better and is now supported across all major browsers. Serving next-gen formats instead of JPEG and PNG cuts load time.
PageSpeed Insights collects each BMP, JPEG, and PNG image on the page and converts it to WebP; it skips images where the potential savings are under 8 KiB.
To serve next-gen images, you need an extension that brings the capability to Magento. With the module, configure your store to use WebP in the Image Optimization section by turning on Use WebP images. The images appear once they're generated and the cache is cleared. (For the full picture, see our guide to WebP images for Magento stores.)
12. Defer offscreen images
A page loads faster when it only loads what the user can see. But a page often has images that aren't visible until the user scrolls to them.
The fix is lazy loading, which can be supplied by an external module: images transfer only once they become visible.
The module supports lazy loading; configure it in the Image Lazy Load section.
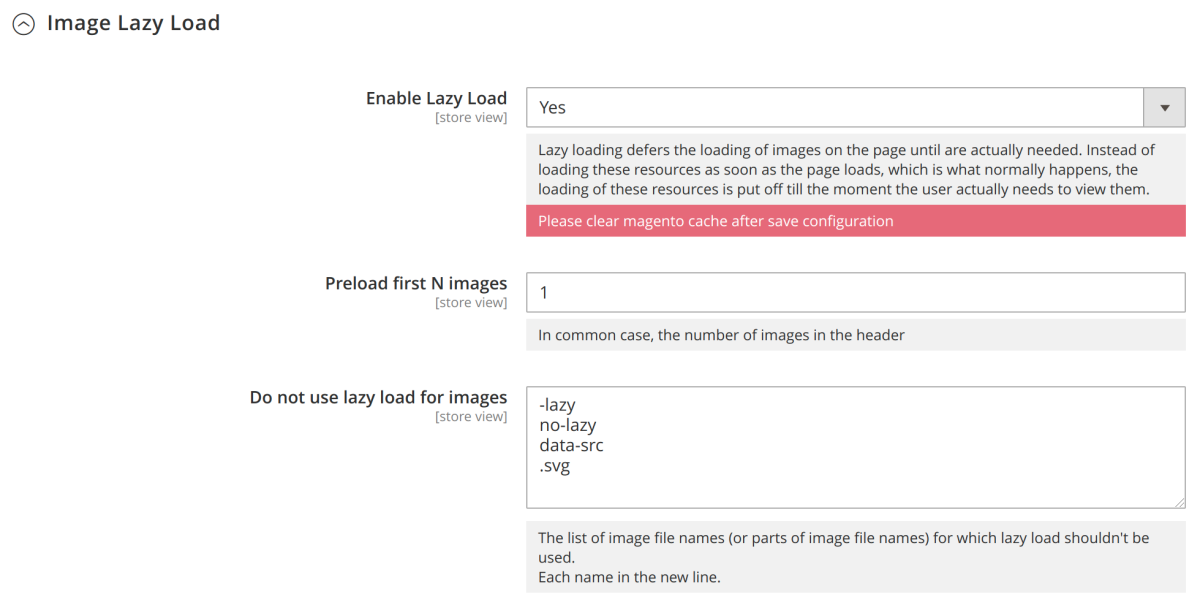
Preload first N images sets how many images load at once. The goal is to load and display everything visible without scrolling, immediately.
On mobile, fewer images are visible than on desktop. As a rule, optimize for the mobile version.
Some images (in a site menu, say) are only visible when the user hovers over a menu item. If your page has such elements, use the Do not use lazy load for images option, which adds patterns for parts inside the <img> tag so pictures visible without scrolling display immediately.
You can also add exceptions here for images that don't display because of a conflict between WebP and a third-party lazy loader, or between WebP and your styles.
13. Avoid an excessive DOM size
This appears when a page's HTML document is too large. A big DOM tree hurts network efficiency and slows page rendering. Lighthouse warns when a page exceeds 800 nodes and flags it as excessive above 1,400 nodes; it also flags a DOM depth greater than 32 nodes, or any parent node with more than 60 child nodes.
Look for ways to create DOM nodes only when needed, and destroy them once they're not. To evaluate nodes, load your page and note which ones display, so you can remove those that aren't shown initially. For pages that can't avoid a large DOM tree, simplify your CSS selectors.
14. Third-party usage
Resources from outside your page (widgets, chats, ad networks, social buttons, analytics) can be slow. PageSpeed Insights flags pages where third-party code blocks the main thread for 250 ms or longer.
To clear the flag, postpone loading those resources or remove them entirely.
With the module, postpone loading iframe resources like Instagram or YouTube by enabling Lazyload Iframes and Defer YouTube videos.
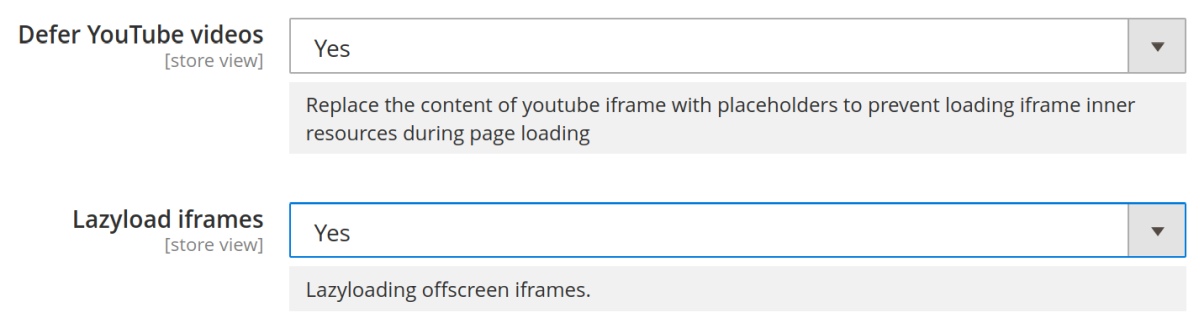
Turn on Lazyload Iframes so third-party blocks load only after they scroll into view. Speed up pages with YouTube videos using Defer YouTube videos: it replaces the video with a placeholder image, and the video and its resources load only after the user clicks. Only enable this if there's actually a YouTube video on the page.
For the heaviest third-party scripts (Google Tag Manager, live chat, analytics), the Delay JavaScript Until User Interaction option goes a step further: it holds them until the shopper interacts with the page, or a timeout fires. That keeps them off the critical path entirely, which is often the single biggest win for main-thread work and INP.
15. Enable text compression
Text resources (HTML, CSS, JS) can be compressed so the server sends less data. You'll see this suggestion if compression isn't enabled.
PageSpeed Insights shows the flag when a page response is larger than 1.4 KiB, or when potential compression savings top 10% of the original size.
Enable compression on the server. On Apache, the options live in the .htaccess file in the store's root folder. On NGINX, include the gzip directive.
16. Preconnect to required origins
Some resources come from third-party sources, and connecting to them early speeds up their load. That's done with <link rel=preconnect>, which tells the browser to open a connection to another origin as soon as possible.
This one rarely shows up when you run a test directly on the PageSpeed Insights page.
The fix is to preload resources by adding them with this tag: <link rel="preconnect" href="https://example.com">. In Magento, adjust the theme's layout XML to add preconnect or DNS-prefetch resource hints. With the module, insert paths to third-party origins with the "preconnect::" prefix using the Preload resources option.
17. Avoid multiple page redirects
Redirects slow load speed. When the browser requests a redirected resource, the server returns an HTTP response, forcing the browser to make another request at the new location, adding hundreds of milliseconds. A page gets this flag when it has two or more redirects.
Point links to the current location of flagged resources, and especially avoid redirects for render-critical resources.
If you redirect mobile users to a mobile version of the page, it's better to redesign the site with a responsive approach. And rather than layering on redirect types, remove the redirect chain wherever you can: the goal is fewer hops, not a different status code.
18. Preload key requests
Some resources critical to rendering are requested by other critical resources. A homepage might declare <script src="app.js">; when app.js runs, it triggers the download of styles.css and ui.js. The page isn't complete until those last two are downloaded, parsed, and executed.
PageSpeed Insights flags styles.css and ui.js as candidates for preloading. Preload them with <link rel="preload">. This flag is often triggered by fonts, so you can solve it with the Preload resources option in the module's HTML Optimization section. On product pages, the module can also automatically preload the main product image (usually the Largest Contentful Paint element) so it starts downloading right away instead of waiting its turn.
19. Use video formats for animated content
Large GIF animations take a long time to load. When a page uses them, PageSpeed Insights suggests a video instead.
A looped, silent video looks like a GIF to the user. WebM is preferable, since WebM videos are much smaller than MP4, but not every browser supports WebM, so it makes sense to generate both.
Mobile browsers like Chrome for Android let users turn on data saving, which blocks videos; GIF animation still shows in that mode.
20. Avoid enormous network payloads
Large network payloads correlate strongly with long load times, and users may burn extra cellular data to reach your page. PageSpeed Insights shows this flag when total network requests exceed 5,000 KiB, and recommends aiming below 1,600 KiB, an empirical number that keeps load time under about 10 seconds on a slow 3G mobile connection.
Some ways to keep payload down:
- defer requests until they're needed (a PRPL pattern is one approach)
- make requests as small as possible: minify and compress, use WebP instead of JPEG or PNG, set JPEG compression to 85
- cache requests so repeat visits don't re-download resources
With the module, use Minify JavaScript, Minify CSS files, and Merge CSS files. You can also apply the tips for Third-Party Usage and Remove Unused CSS.
Final thoughts
One thing to keep in mind before you chase a perfect score: PageSpeed Insights is only an indicator, and not always a reliable one. Run it twice and the number can swing. What matters more is whether the site actually feels slow to a real person, whether elements lag or stall. It's subjective, but it's the best signal you have.
That splits into two very different situations. If a store feels genuinely slow, you don't need PSI to tell you. The owner feels it and acts. If it feels fine but the score is low, the reason to fix it is SEO, not conversion.
And the score can be plain misleading. We once worked with a store whose catalog was non-standard: the product grid loaded over AJAX. PageSpeed Insights couldn't see it - Lighthouse caught the "empty," fast first render, while the real content arrived later. The number looked great; the experience didn't match.
So reaching 100/100 is almost impossible, and it isn't always the goal. The test checks speed while ignoring the purpose and value of your site. The best way forward is to balance customer satisfaction against raw speed.
Key takeaways:
- Fix from the biggest lever down: theme first (Hyvä is architectural), then targeted optimization on top.
- Start with JavaScript optimization and a smart, per-page-type merge, then enable one option at a time and re-test.
- Watch Core Web Vitals (LCP, INP, CLS) in the field data, not just the lab score.
- Treat 100/100 as a vanity goal. Optimize for how the site feels and for SEO, not for the number.
The payoff is real. Portent's 2022 study found conversion rates drop about 4.42% for every extra second of load time between 0 and 5 seconds, and roughly 47% of users expect a site to load in under 2 seconds. If your store does $10 million a year and a one-second speed-up raises conversions by 2%, that's a $200,000 increase in revenue. We've covered the mechanics of that trade-off in more detail in page speed and conversion rate.
Read next: Core Web Vitals for Magento 2 and 15 hacks to optimize Magento store performance.
FAQ
What is a good PageSpeed Insights score, and is 100/100 possible?
A score of 90-100 is green (good), 50-89 is orange (needs improvement), and 0-49 is red (poor). Reaching a perfect 100/100 is almost impossible on a real Magento store, and it isn't the goal: the score checks speed while ignoring how the site actually feels. Aim to move into the green and to fix what makes the site feel slow, not to chase the last few points.
Which Magento theme is best for PageSpeed Insights?
Hyvä. Your theme sets the ceiling for how fast a store can be, and Hyvä is an architectural leap over the default Luma theme. On our own site, moving from Luma to Hyvä (with no design change) took the score from about 70/50 desktop/mobile to 90+/80-90 with no further optimization. You still benefit from an optimization module on Hyvä for images and monitoring, but the theme is the single biggest speed decision.
What is the difference between lab data and field data in PageSpeed Insights?
Lab data is the Lighthouse score, generated in a controlled test environment. Field data is real Chrome user experience over the last 28 days, taken from the Chrome User Experience Report (CrUX) and shown at the top of the report as your Core Web Vitals. They don't always agree. A page can score well in the lab and still feel slow to real users, so treat the field data as the more honest signal.
Are PageSpeed Insights report links temporary?
The score itself isn't stored permanently. PageSpeed Insights re-tests the page each time you run it, and the number can vary between runs. Treat any single result as a snapshot rather than a fixed rating, and re-test after each change to see the real effect.
Writer