Grow Your Business with Magento Reports: Inventory, Sales, and More
-
 Eugen Barilyuk
- Magento 2
- Updated: Oct 29, 2022
- 8 min read
A historical data gathered in the online store database is vital for tracking the business performance, and analyzing its overall health. Having an in-depth reporting in your store can highlight the most and least profitable goods or clients. If you know the trends in your store you can see potential issues and make effective strategic decisions.
Your Magento store has all the statistics required for knowing the exact business situation. Use this data can to make best business decisions: data-driven strategies and promotions are a proven way for generating more profits. Here is a set of reports a Magento store can use to get a complete view on its performance.
Typically for getting an in-depth look on your Magento store performance a third-party extension is required. The view on reports you can get in your Magento store is shown with the help of the Advanced Reports for Magento 2 module.
Inventory/stock reports
Reports on inventory show the balance of goods. They are an important part of building a sales and inventory supply strategies.
Keeping track on inventory is essential for a business to be highly profitable. These reports are invaluable in mitigation of a significant barrier to sales - out-of-stock situation.
How to see the number of products in stock
From 21% to 43% of shoppers will go to another store if they face out-of-stock situation in the store they intended to buy from. These missed purchases correspond to losses of about 4% sales. Retailers lose sales on nearly $984 billion per year because of out-of-stock situations.
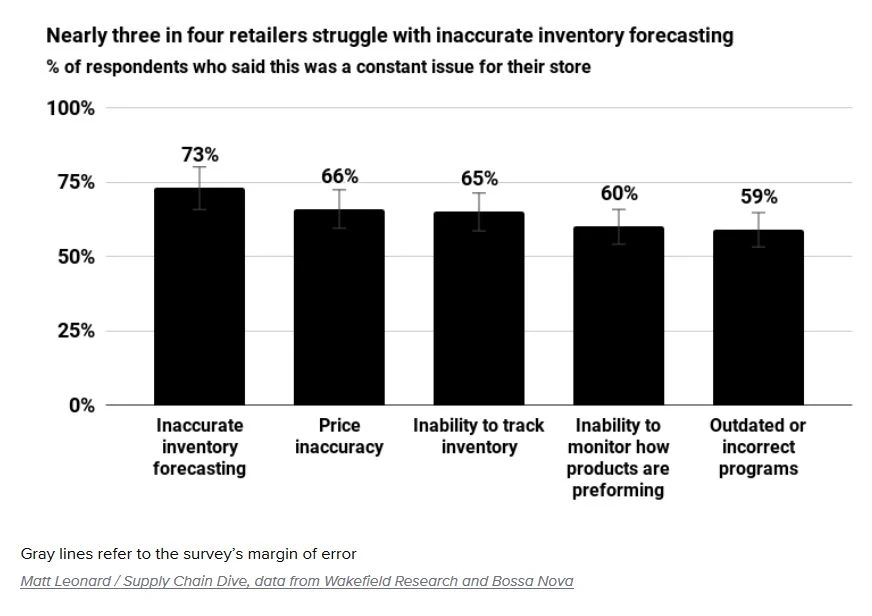
Almost 72% of stock-out cases occur due to miscalculations of the store managers, who mismanage inventory data. A store can reduce its stock-out rate by 22.5% closely monitoring the product stock quantity.
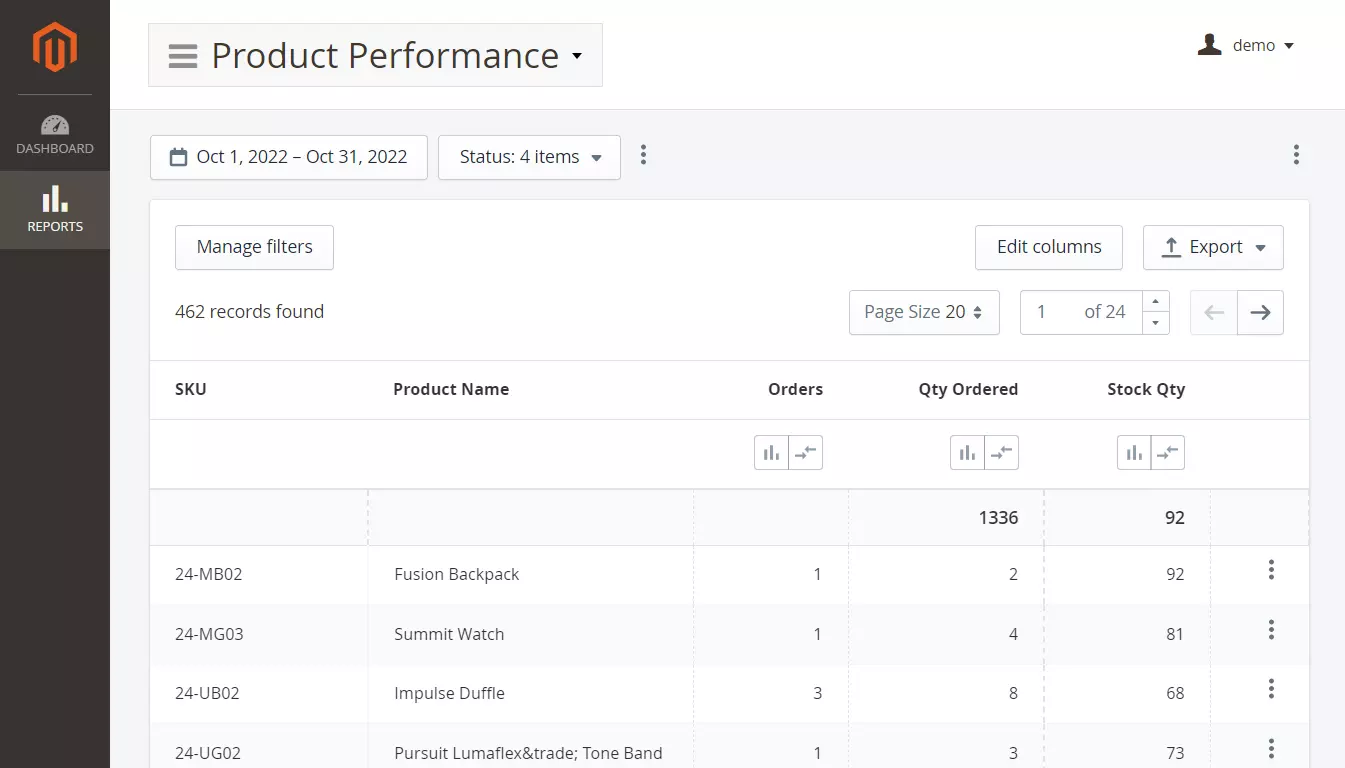
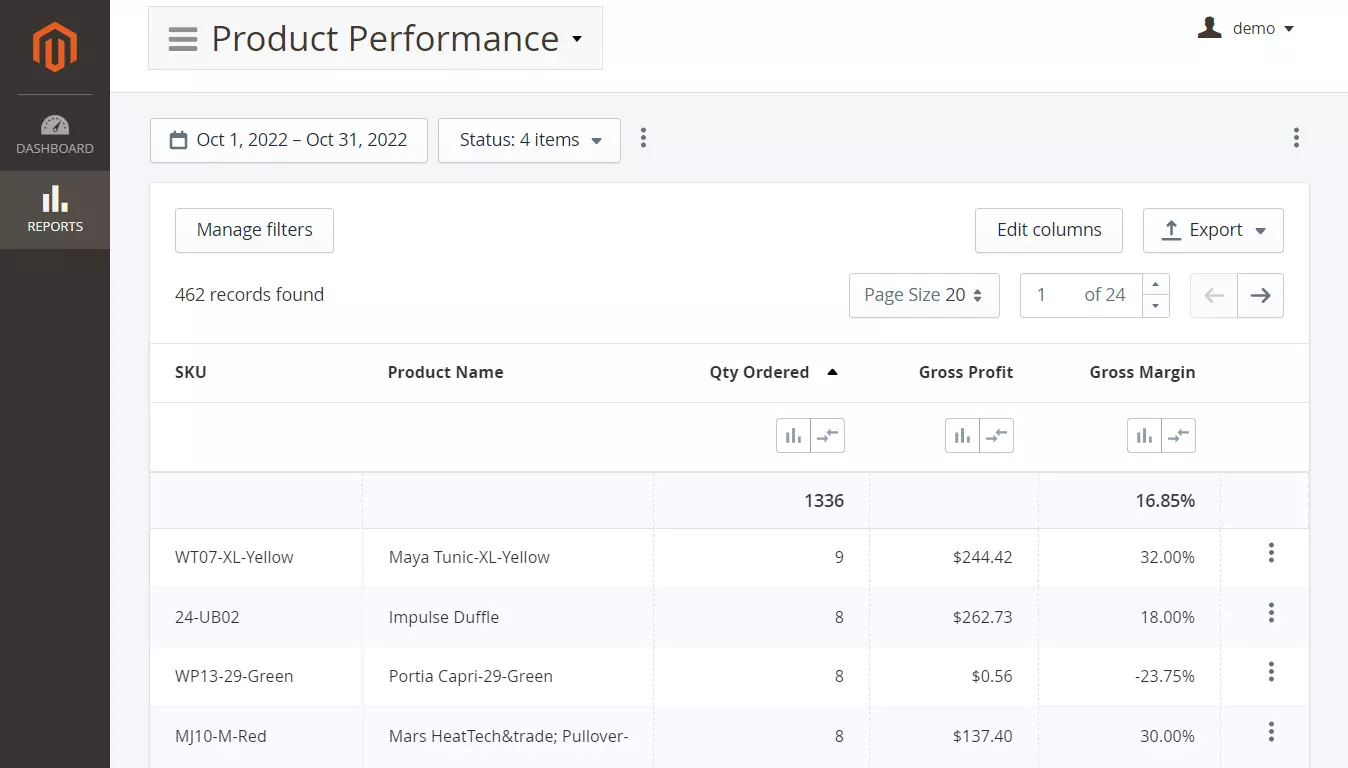
To get data on how many items of each product you have left for sale use a Product Performance report. Open it and add a Stock Items > Stock Qty column.
How to track what products should be replenished soon
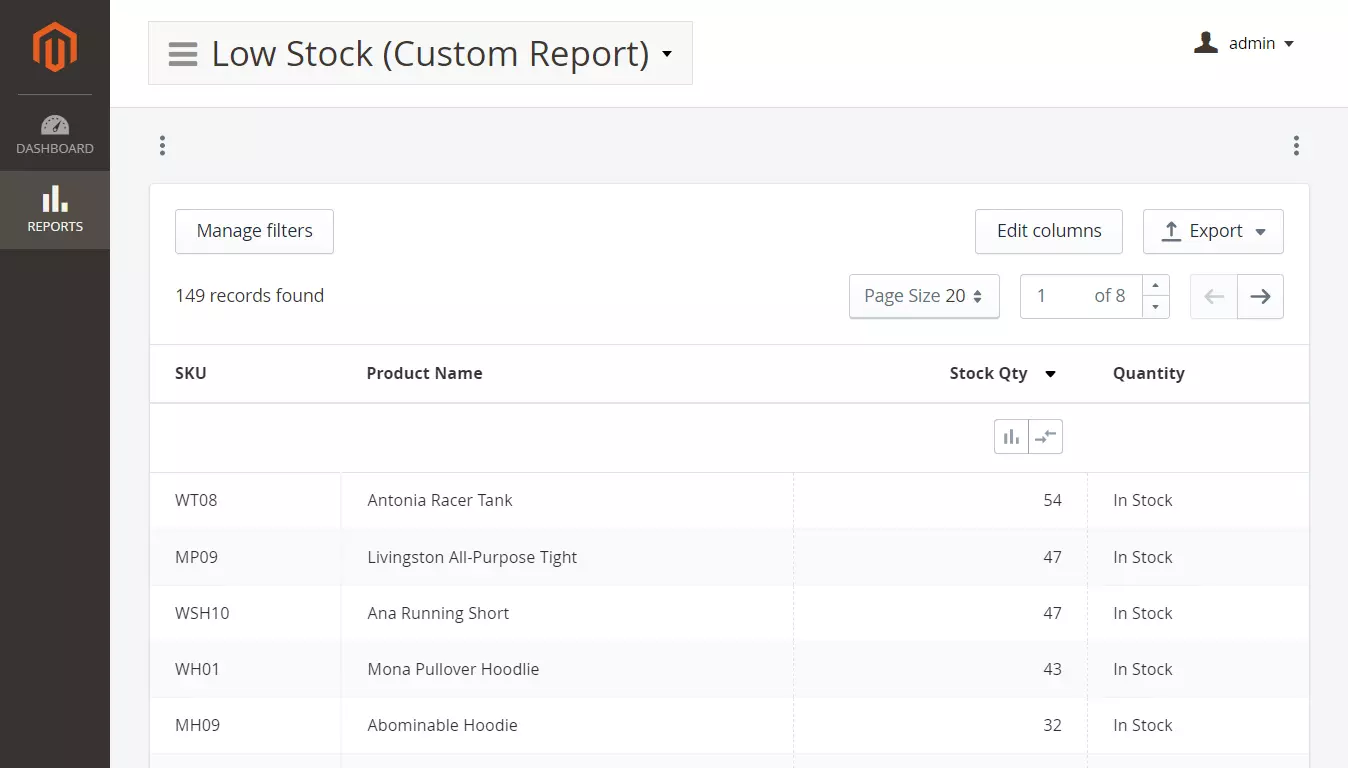
Set a designated minimum level of items in stock and quickly see what products need to be replenished soon with a Low Stock custom report. It shows items that have stock reserves lower than a specified minimum.
How to see bestselling and most profitable products
Inventory data can also provide an answer to the question which products contribute the most to your profits. Such information is valuable when renewing a product catalog.
See the best selling goods by adding an Orders > Gross Profit column to the Product Performance report. To know how quickly a specific product sells in a chosen time range you should simply sort the table by Qty Ordered column.
How to see low quality products
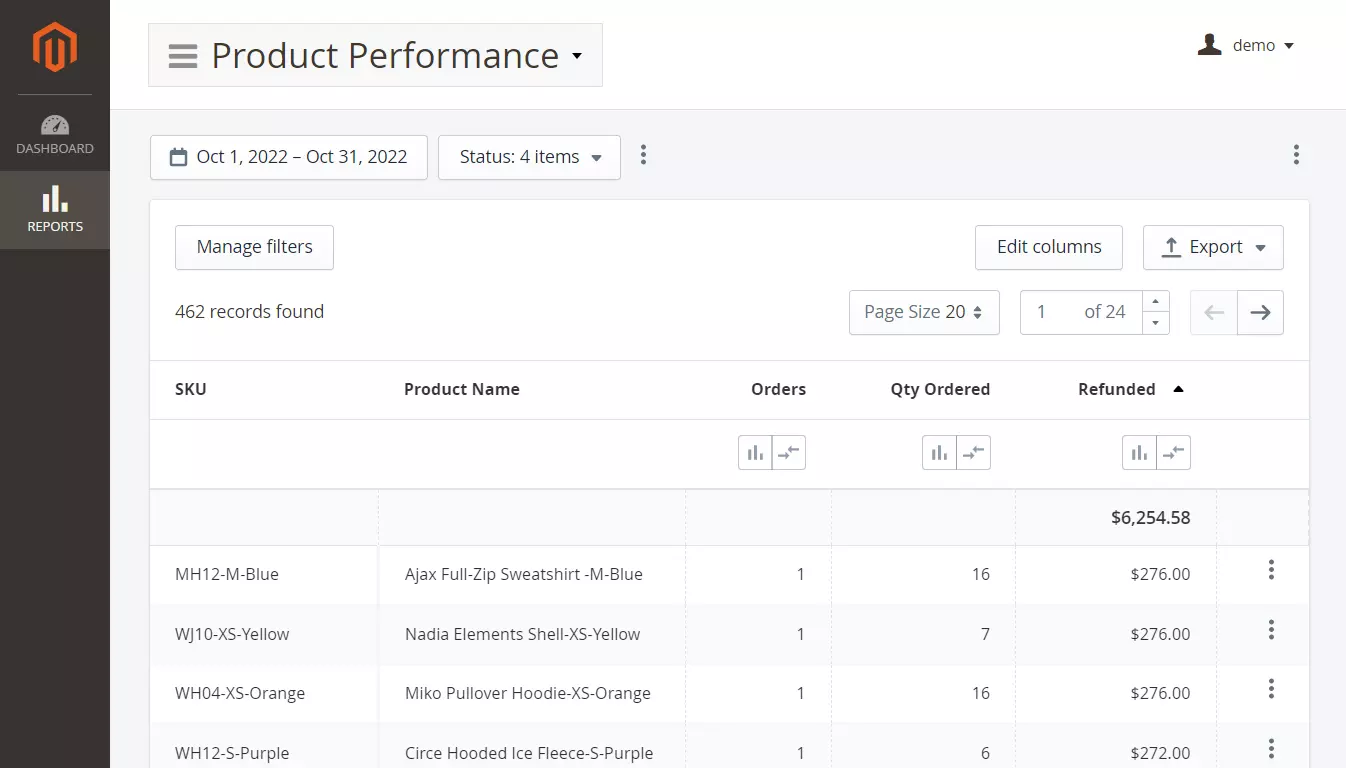
Alternatively, the Product performance report can be used to see products that have low quality. Sort the table by the Refunded column to see what products customers return back to the store.
It is a good practice to view the inventory/stock reports regularly for more cost-effective inventory management. Additionally, these reports give an insight on goods best suitable for promotions and discounts.
Product abandonment reports
On average 68.8% of shoppers do not finish their purchase and abandon their cart. Increasing the number of placed orders is a complex task that requires multiple different sources of data to be solved successfully.
How to get hints for reducing abandoned cart rate
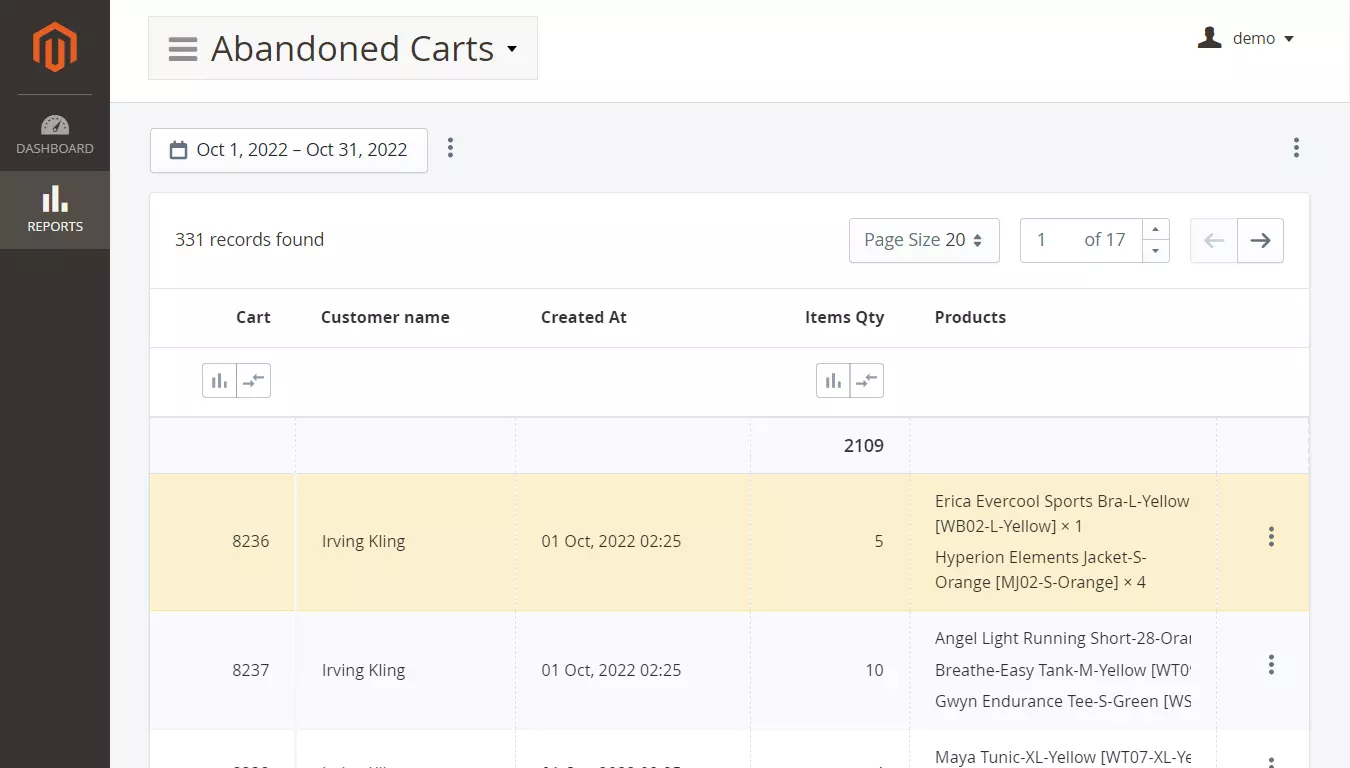
The reports Abandoned Carts Overview, Abandoned Carts and Abandoned Products will show you the financial losses from missed sales, and what exactly products were abandoned.
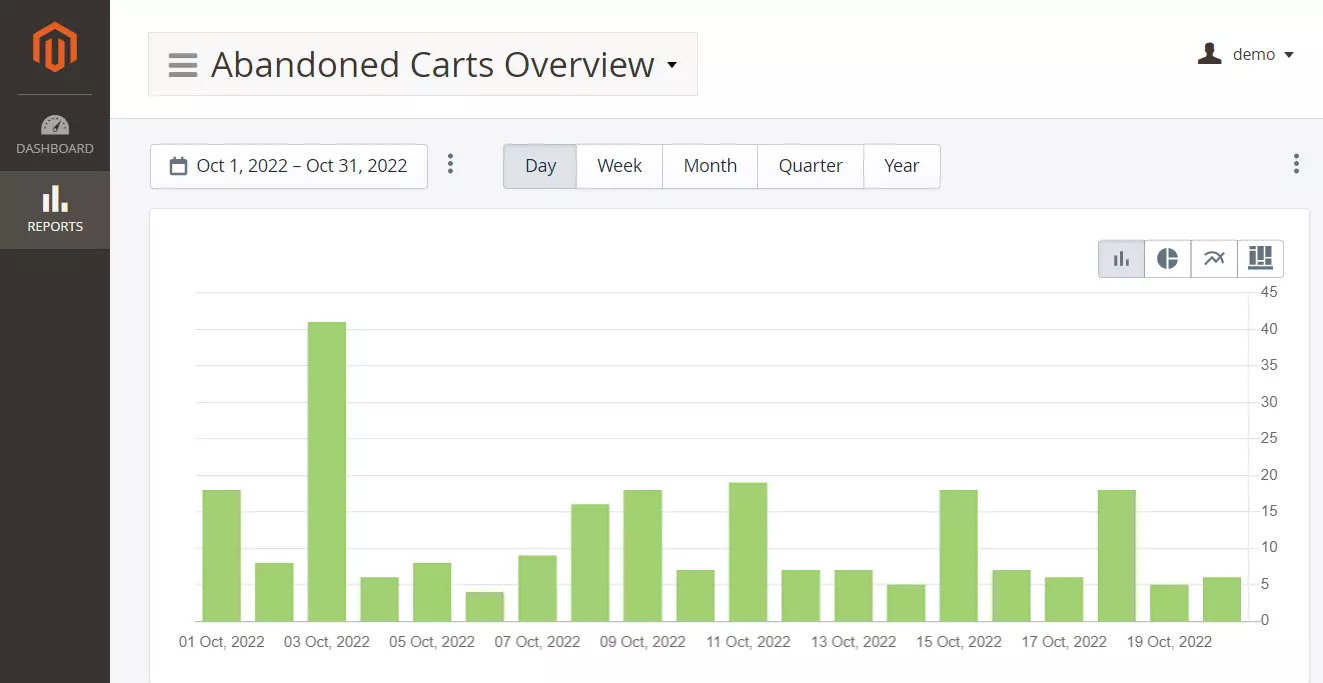
Use the Abandoned Carts Overview report to get a macro view on the financial statistics of missed sales. View the data split up by day, week, month, quarter, and year.
The Abandoned Carts report shows each customer who abandoned his cart. The table depicts when the order was created, the quantity and names of included products.
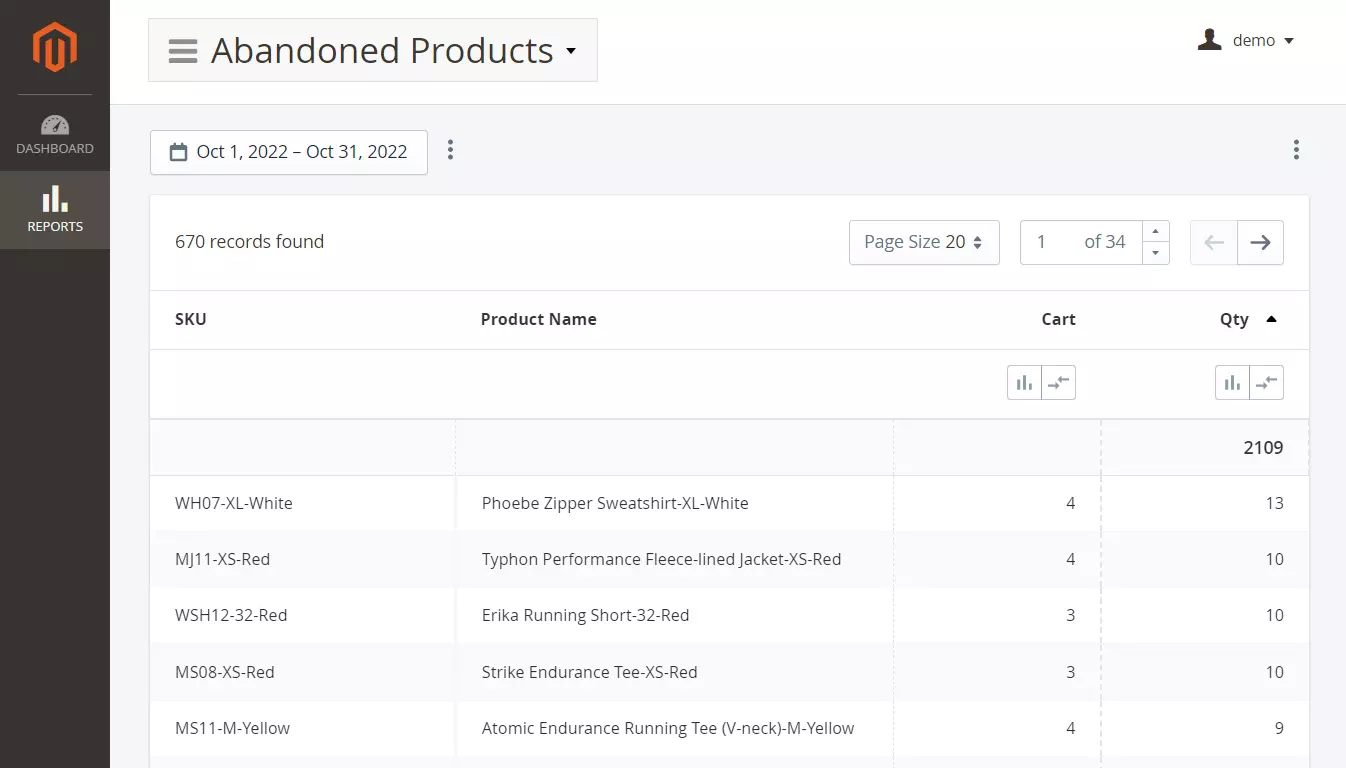
You may also want to know what products are most often abandoned in your store. Use Abandoned Products report for such information.
Sales reports
Reports on sales give an overview on the sales for a specific time period. From the general Sales Overview report you can dive into sales specifics by building such reports as:
- Sales by Hour/Day of Week
- Sales by Coupon
- Sales by Cart Price Rules
- Sales by Category
- Sales by Geo-data
- Sales by Payment Type
- Sales by Tax Rates
- Sales by Customer/Customer Group
- Sales by Attribute/Attribute Set
These sales reports also show COGS, gross profit, profit margin providing clear view on store financial success.
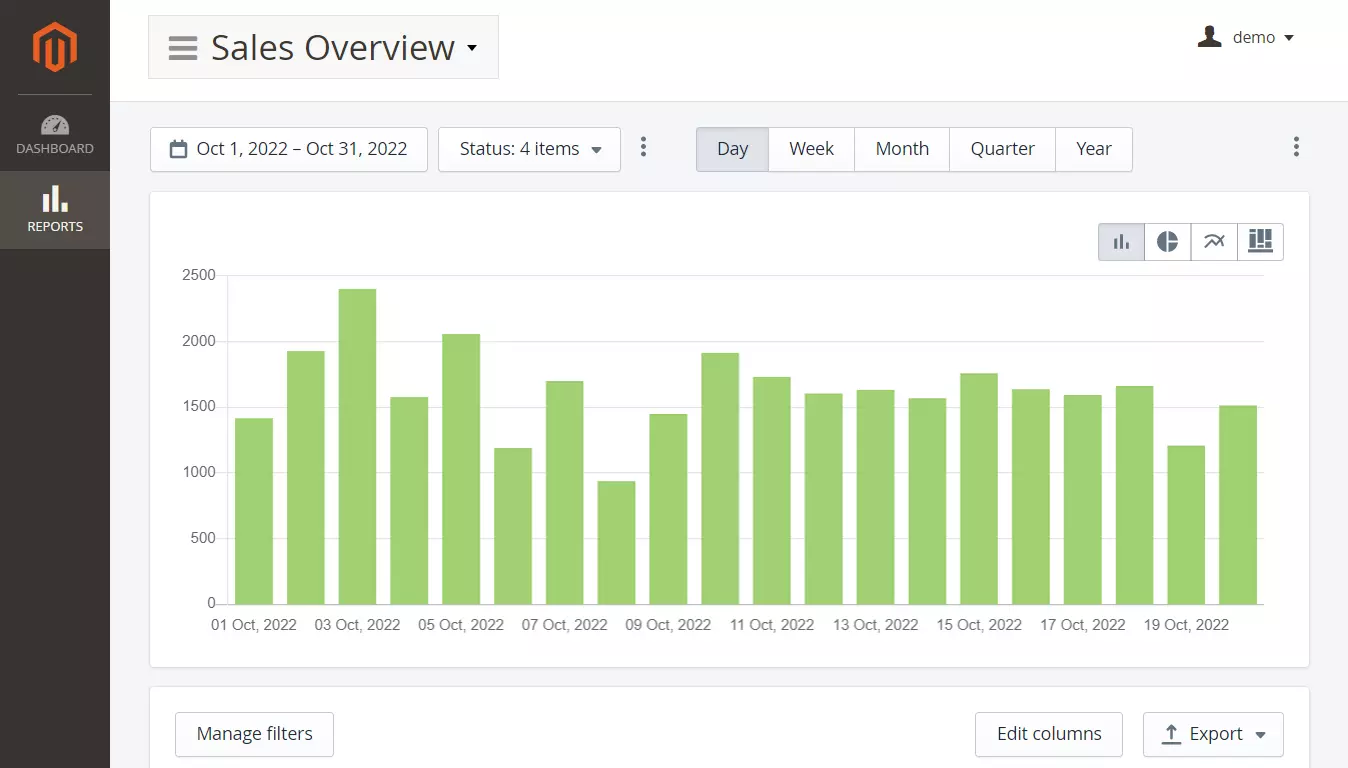
How to get macro view on sales
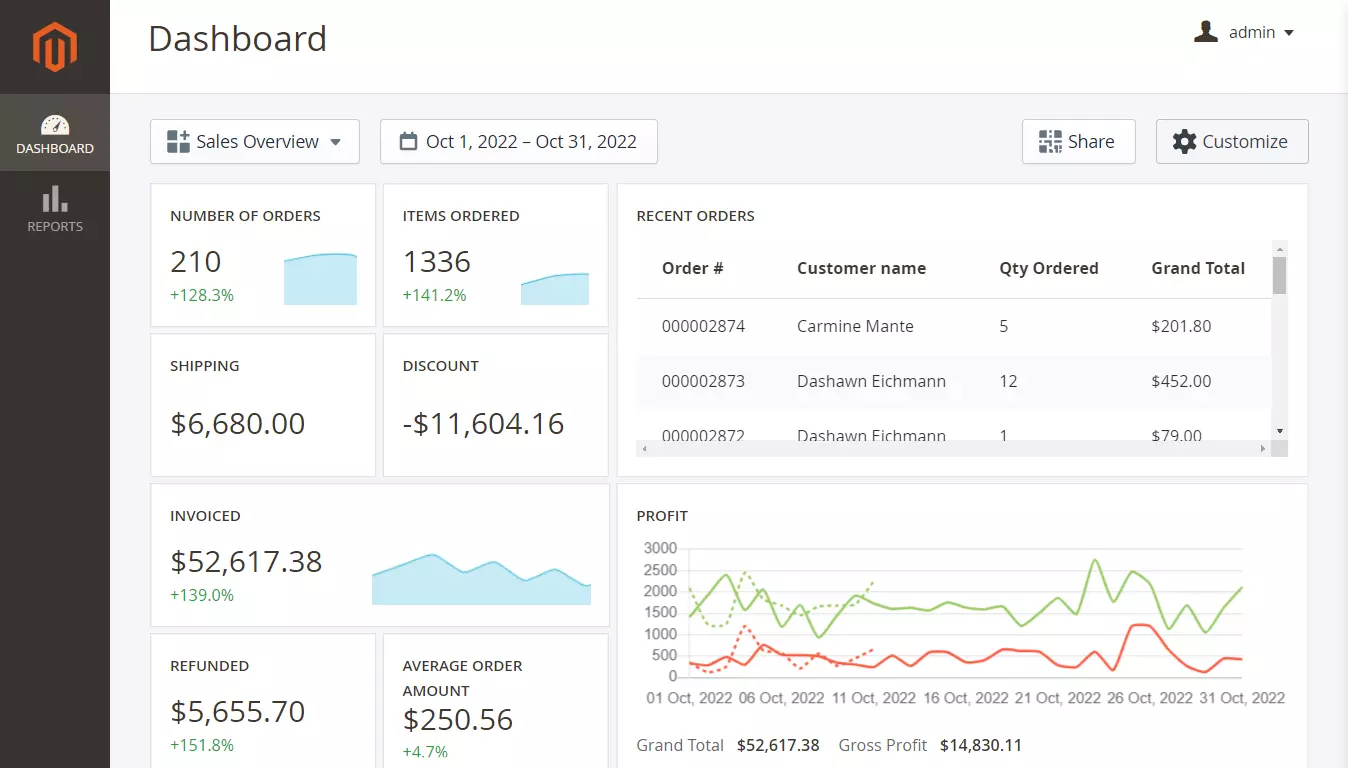
The Sales Overview report is vital for retailers as it provides a macro view on the retail data: shipping, taxes, discounts, refunded, gross margin, and grand total. Typically this report presents data per each day of the specified time range. However, you can sum it up to weeks, moths, quarters, years.
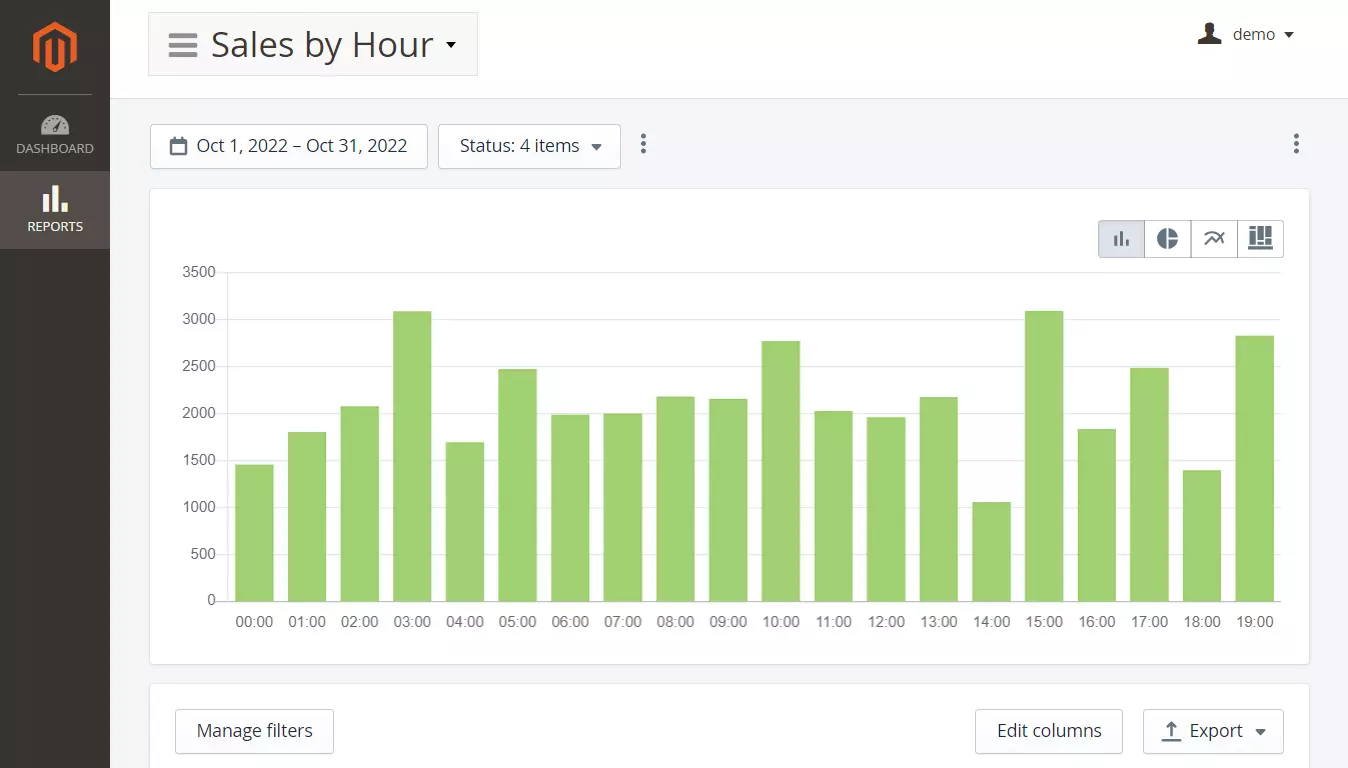
How to see peak sales time by hour or day of week
A more narrow view on sales can be obtained with an hourly sales report. This document will show you the peak sales hours in your store. Knowing such information will help to optimize store infrastructure and staff accordingly.
For example, if a store uses cloud hosting, it can expand its processing power to serve clients during peak hours. After peak load passes the processing power can be reduced to save money on cloud services.
There is another report with similar purpose as Sales by Hour. With the Sales by Day of the Week report a store manager can see what days of the week are busy sale days within the specified period. For example, Monday may be an unexpected busy sales day.
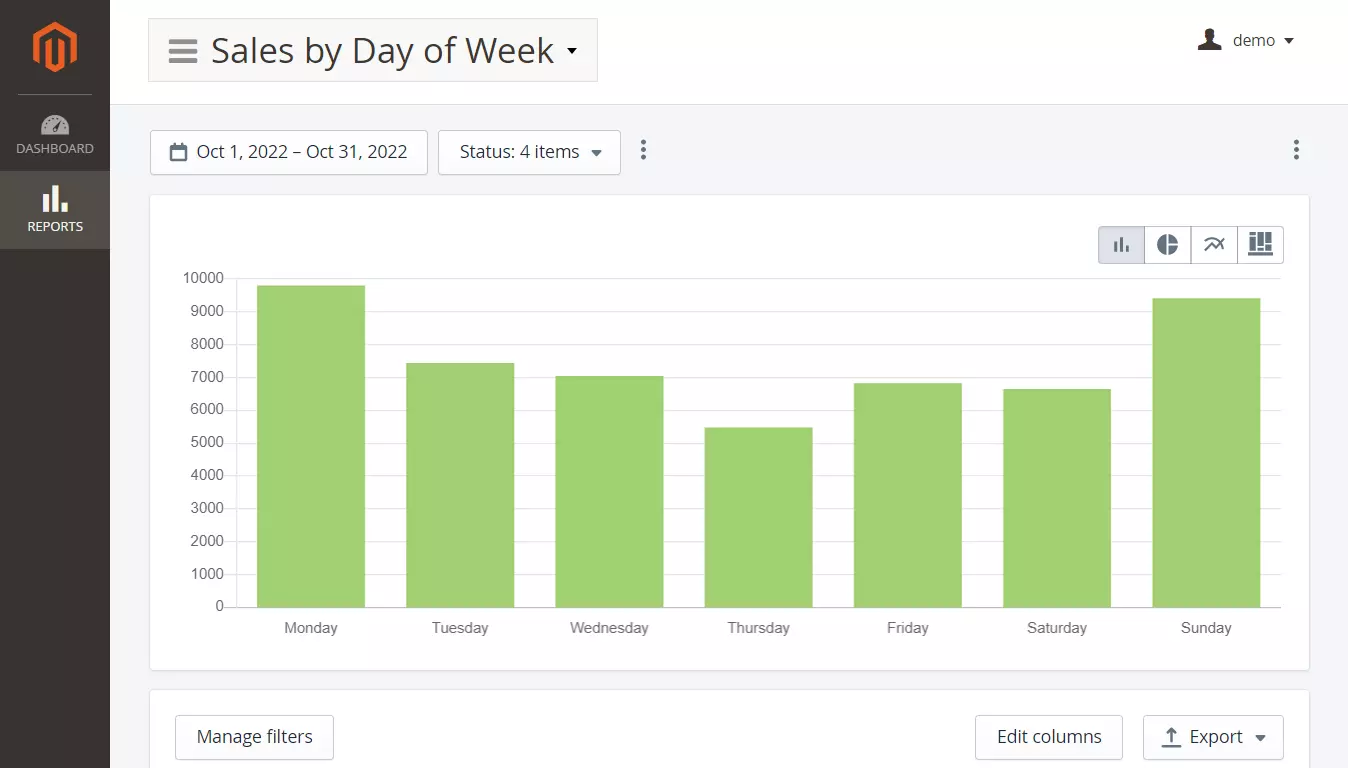
In addition to optimizing infrastructure and staff load these two reports can give hints on when to launch promotions, special offers, etc.
How to see marketing campaigns efficacy
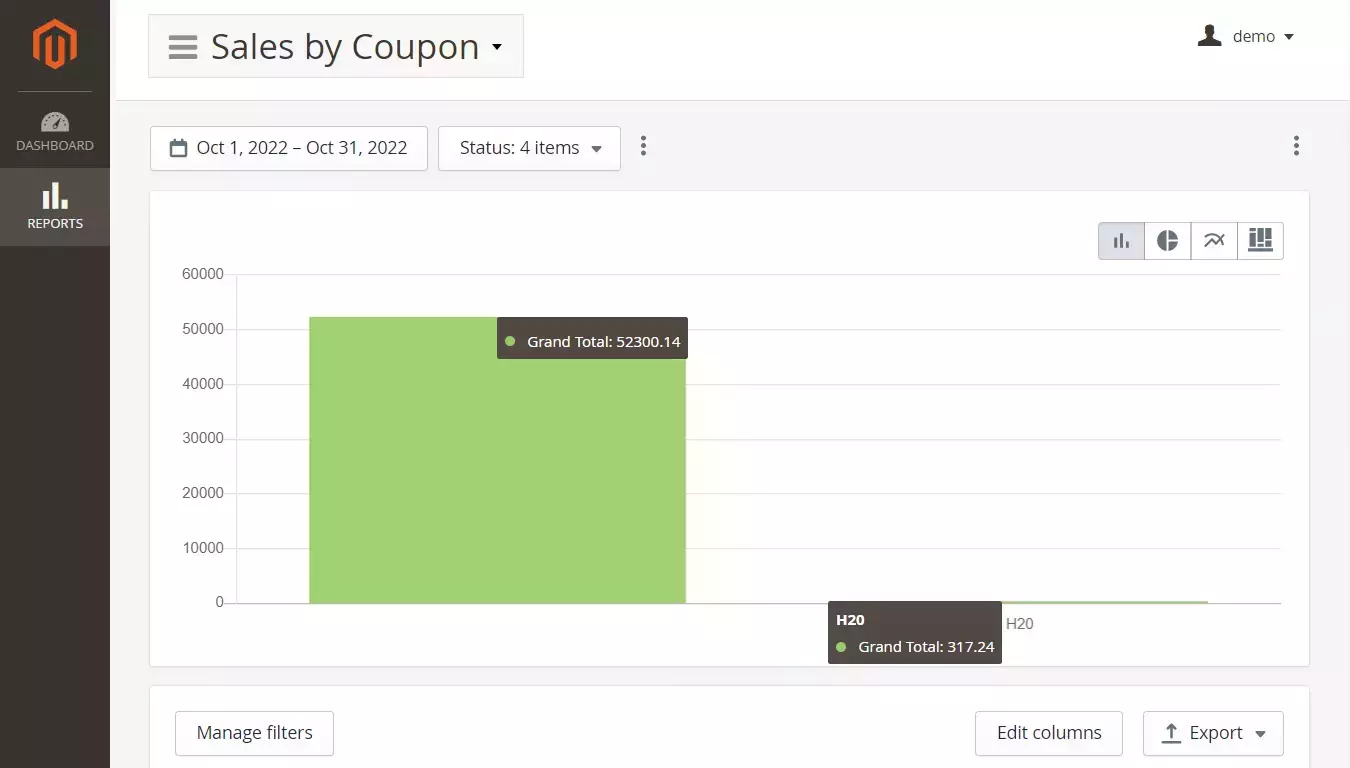
Discounts are an effective way to stimulate customers in buying more. When a store gives promotional coupons it is important to know how well it marketing campaign performs.
The Sales by Coupon report depicts Grand Total data for each voucher a store issued. This information is shown in relation to the total non-coupon sales so it is easy to see the success of each marketing campaign.
How to track Cart Price Rules effectiveness
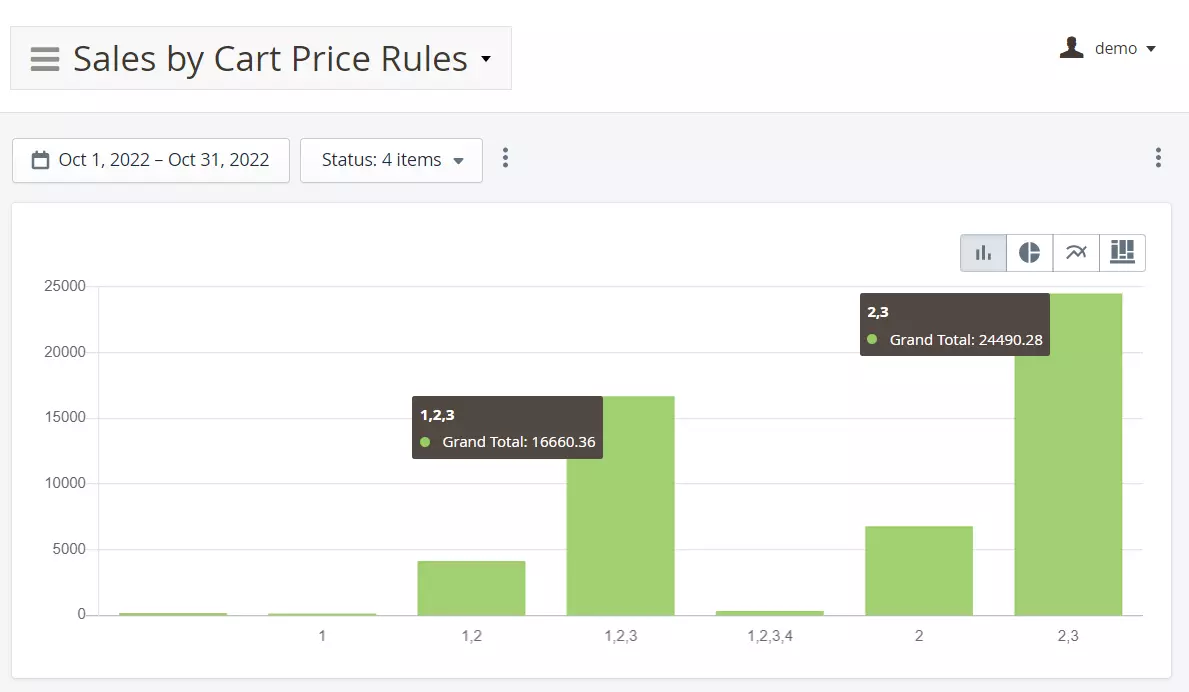
Magento store can promote buying by making a discounts to items placed into to the shopping cart. A set of conditions for these discounts is called Cart Price Rules. Knowing what rules bring you most revenue you can optimize the discount strategy, eliminating non-effective rules.
The sales report on the Cart Price Rules shows the chart on the Grand Total for each Cart Price Rule ID applied to orders. The default table also shows data on the number of orders for each rule, Gross Margin, refunded, tax, shipping discount amounts.
How to see the most profitable customer in your store
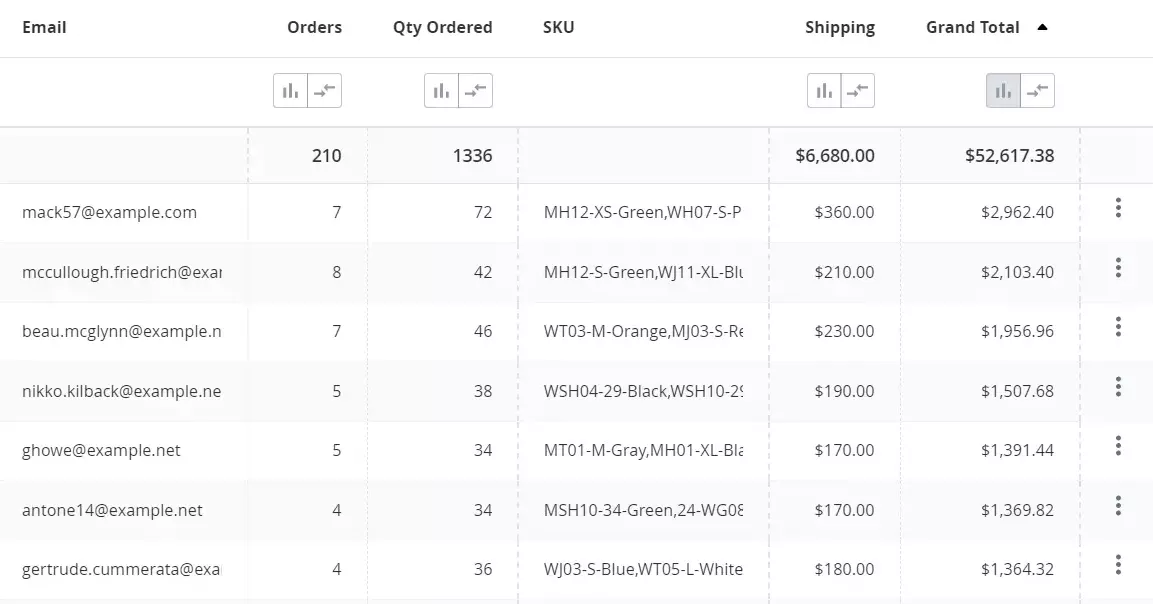
You can see the most valuable customers and customer groups of your store. The Sales by Customer and Sales by Customer Group reports show how much profits they brought to your store, as well as other financial data.
For example, you can see the cost of shipping to your most profitable customers and optimize the delivery to reduce its costs. Offer additional discounts to your top clients to stimulate them buy more from you.
Add a product SKU column to see what exactly items your most valuable customers and customer groups have purchased within the specified time period.
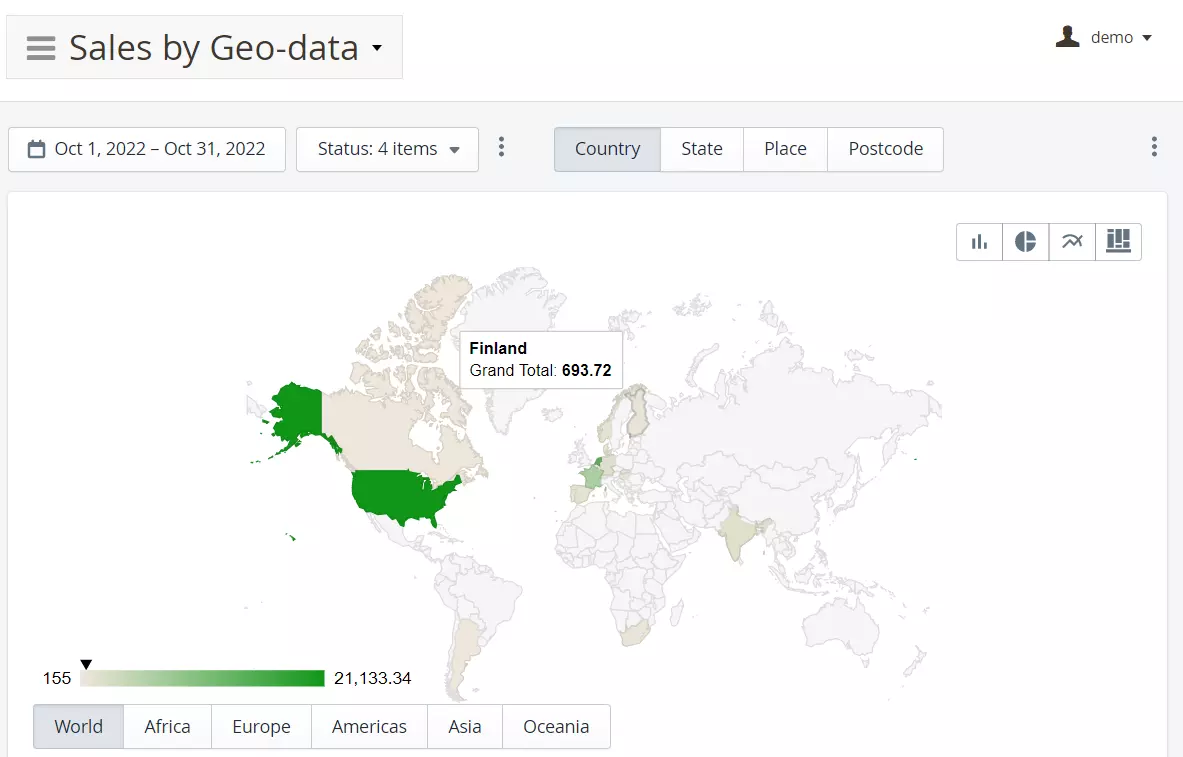
How to see what cities/countries are most profitable for your store
Optimizing shipping expenses can bring a significant profitability increase for a Magento business.
Your store database tracks the location of every customer, allowing you to see where you sell most. Use this information to reduce your delivery expenses to these regions. For example, there may be a more suitable subscription plan of the delivery service for your store needs.
With Sales by Geo-data report you can see orders in your store by countries, states, cities, or postcodes. The data is displayed graphically on a global map, and in a table.
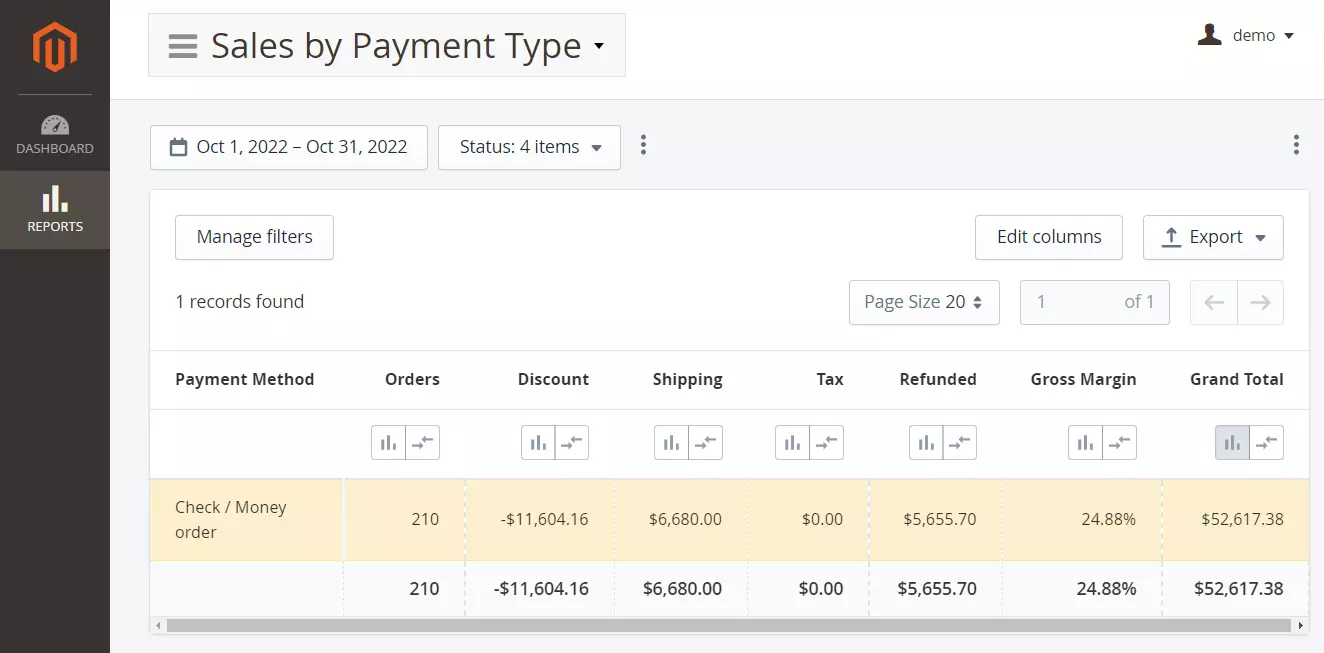
How to get hints for optimizing payment expenses
Processing payments for orders costs money and Sales by Payment Type report shows what payment method is most popular in your store.
Knowing the most popular payment method in your store can give you hints on optimizing the processing expenses. You can migrate to more suitable payment processing subscription plan. Alternatively, you can stop paying for payment providers that are seldom used in your store and save money.
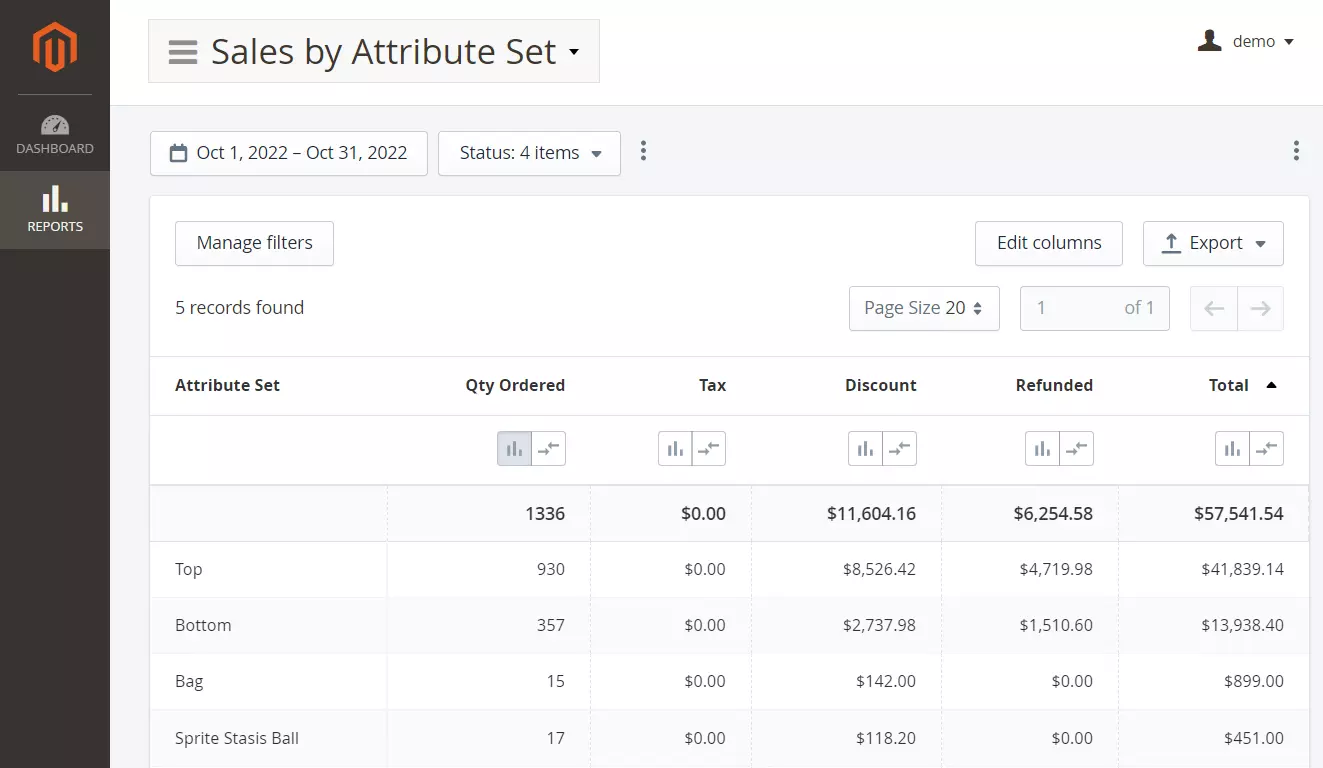
How to make decisions on goods for your product catalog
When deciding what products to sell in your store it is a good practice to see on sales of items you already sell. The Product Performance report shows how well exact products sell in your store.
You may also use Sales by Category, Sales by Attribute, and Sales by Attribute Set reports to see what types of products your customers are mostly interested in buying. Alternatively, use these reports to see what product types you better avoid in your product catalog.
Summary
Magento gathers multiple points of valuable historic information, which can help optimize the business and increase revenue.
To extract this historical data you can use an Advanced Reports for Magento 2 module. It can quickly give you answers on many questions that influence your profitability. For example, you can see low quality products or what items are abandoned in carts most frequently.
With reports you can combine various historical data on sales to get a flow of insights for making your business thriving.
Writer