How to improve Magento 2 Page Cache Hit Rate
-
 Oleksandr Drok
- Magento 2
- Updated: Sep 22, 2026
- 5 min read
Updated: refreshed with current hit rate benchmarks and a new section on why fill rate and hit rate aren't the same number.

Unlike Magento 1, Magento 2 comes with a built-in Full Page Cache module. It speeds up the store, but only for the requests it actually serves. That share of requests is the hit rate, and it isn't the same number as a cache warmer's fill rate. Mixing the two up is a common reason a store still feels slow while its warmer reports that everything is fine.
In principle, the module repeats M1 Enterprise Page Cache: the page contents are completely cached, but dynamic information is updated through AJAX requests. This technique reduces server response time for regular frontend pages.
AJAX updates only user-specific information: login status (in the top menu), shopping cart (in the header), recently viewed products, etc.
Consequently, for caching to work correctly, all extensions installed on your store need to account for this peculiarity. This makes sure that updates to dynamic information will be made properly.
Another vital fact to consider is the possibility for caching a page but only if this page excludes not-cacheable blocks.
As time-consuming as it can be to add, monitor, and exclude these blocks on a large store, the performance benefits are well worth it. You can declare a not-cacheable block in layout files by adding the attribute cacheable="false" there.
To summarize, all pages on the following list cannot be cached by default:
- Login/registration/forgot password pages
Customer account pages
Search results pages (beginning from the version 2.2.4, it becomes possible to declare multiple pages to cache them)
- Cart page
- Checkout, and a few other rarely visited pages
However, the good news is that the vast majority of users' visits go to pages that are cacheable:
- Home page
- CMS pages
- Products list (category)
- Product details
Let's take a closer look into the cache operation cycle:
When a page is visited for the first time, its content is generated from scratch and saved in the cache with a unique identifier.
When this page is subsequently visited in the future, it is "returned" from the cache it was previously added to. This speeds up Magento 2 pages and improves the customer experience.
This cycle is possible if the following two conditions are met:
- The cache lifetime has not yet expired (it is 24 hours by default)
- The previously cached page has not been deleted from the cache; deletion takes place in different cases, but the most basic reasons are a change in related content (category, product) or reindexing.
What is hit rate and why is it so important
Now we are arriving at the most interesting element: the hit rate, or hit ratio.
What is this?
To make a long story short, the hit rate refers to the percent of queries returning a cached page (fast response).
i.e. for every 100 page views, if 75 were served from the cache, the hit rate is 75%.
Hit rate (%) = [hits from page cache] / [total number of hits] * 100
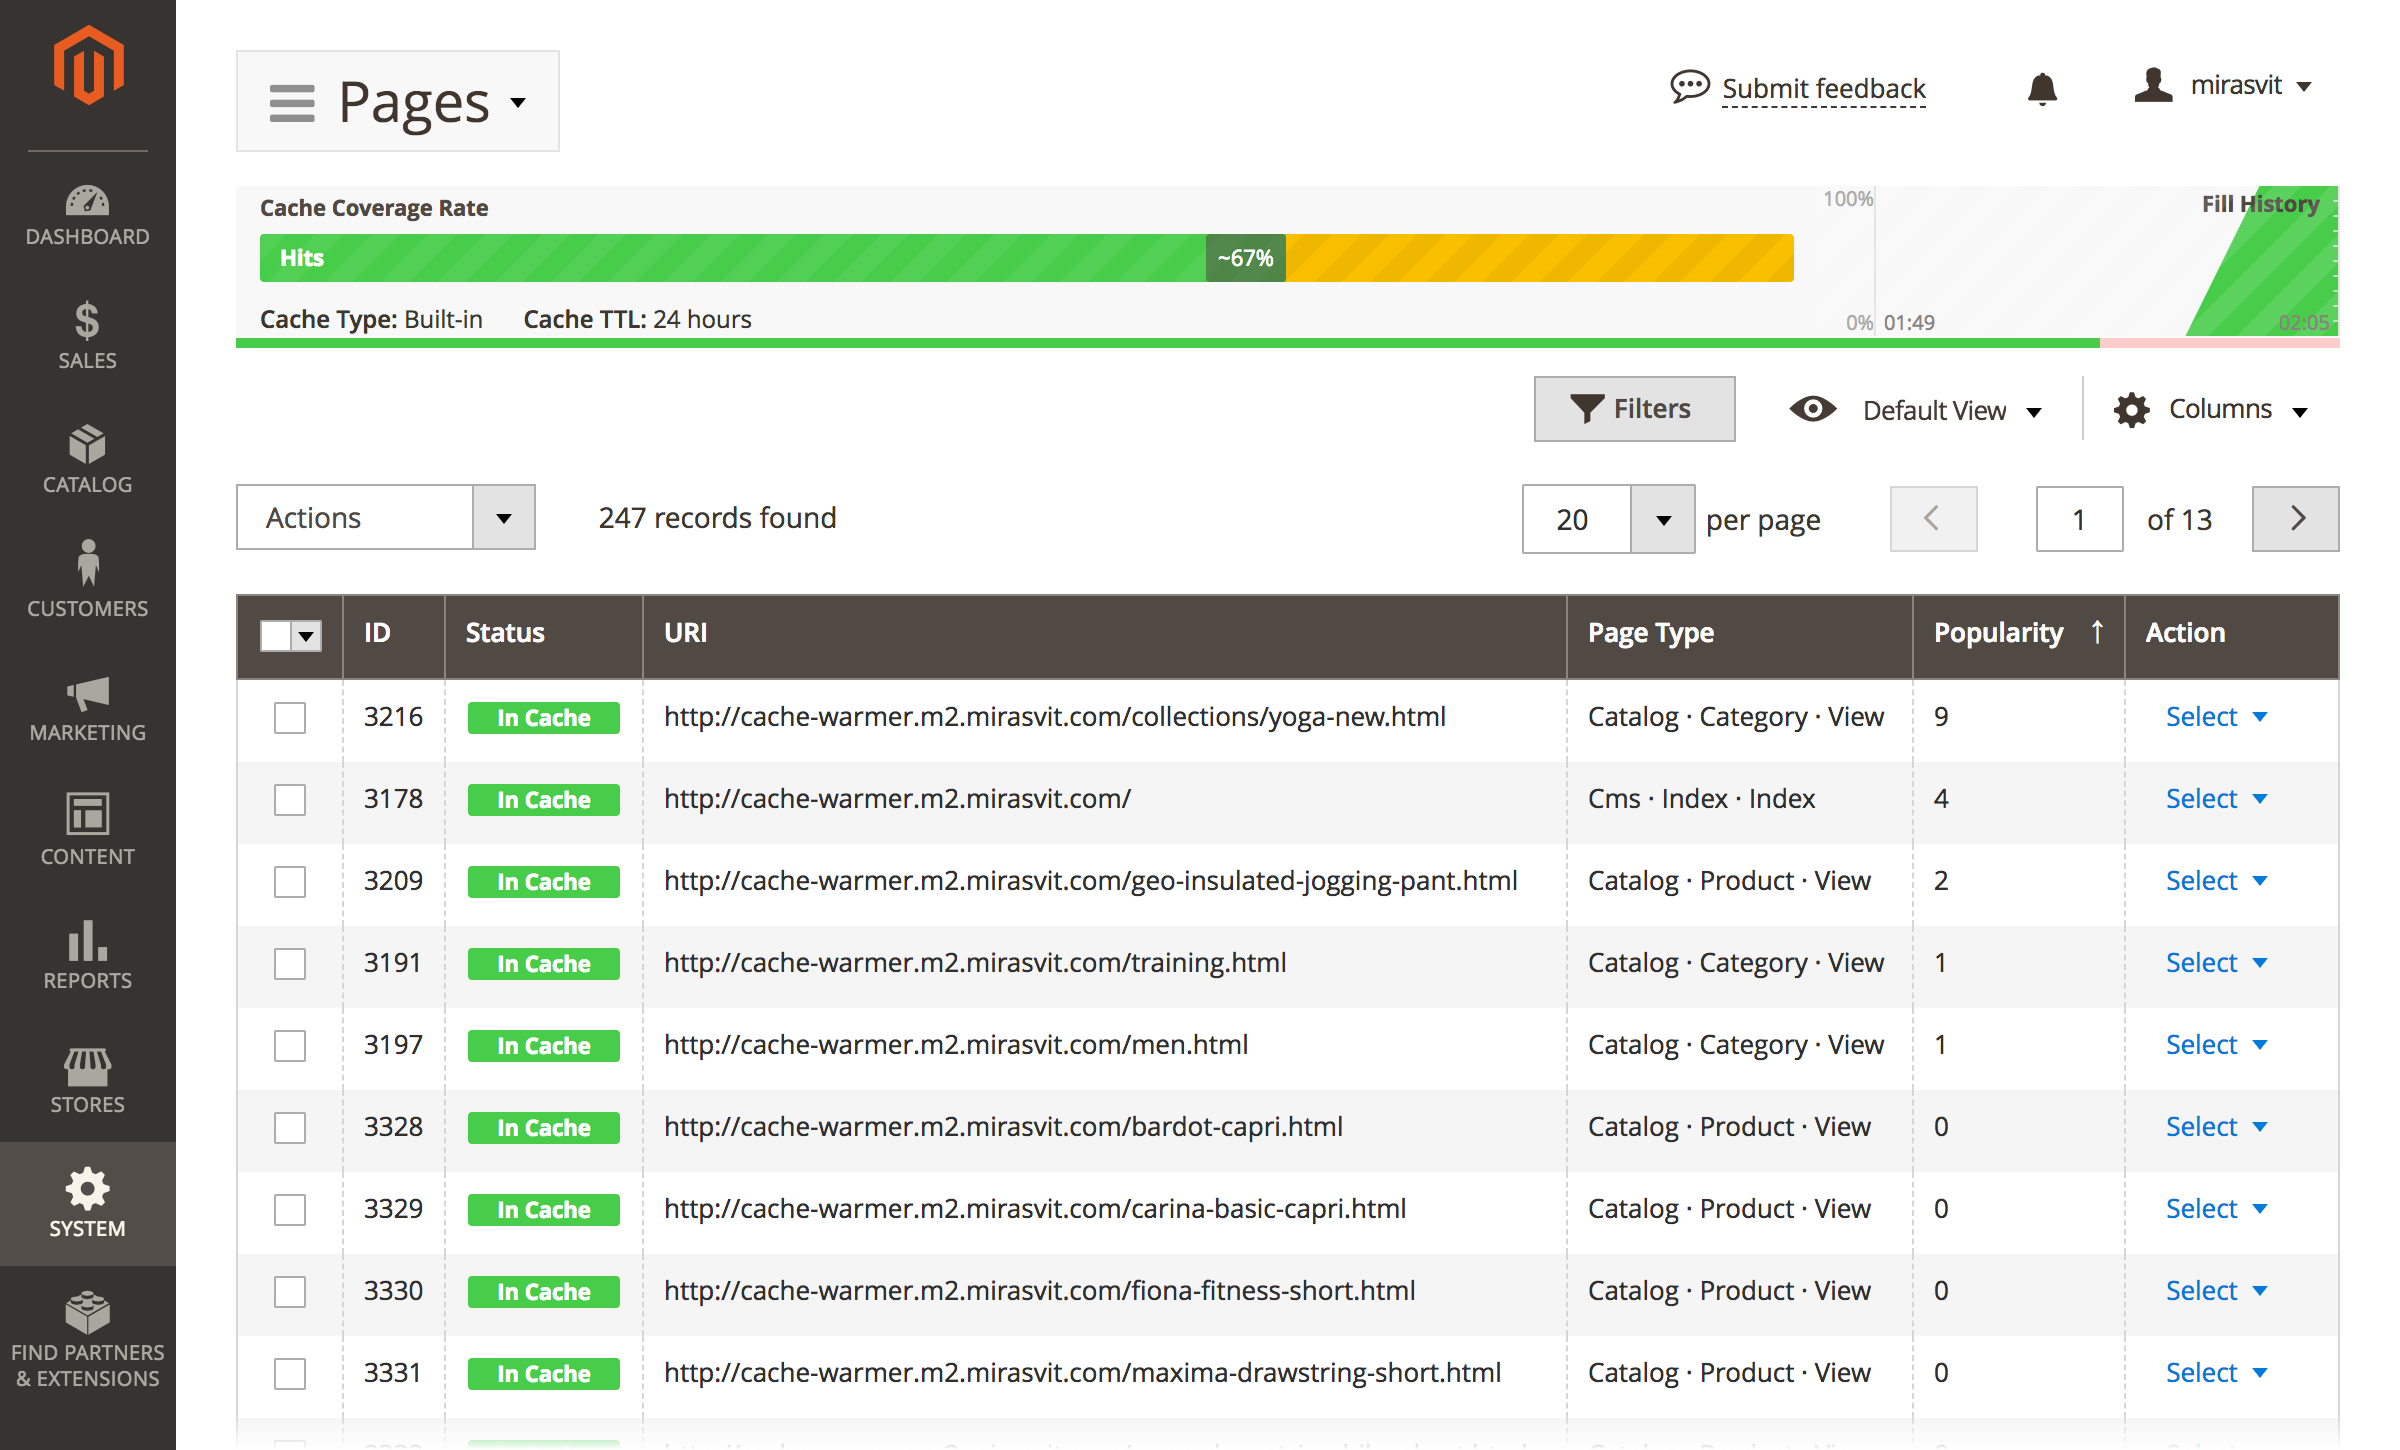
Consequently, if the hit rate is low, most of your users will have to wait for several seconds for the server to respond, which is decidedly not what we are looking for.
Aim for 80-90%+ in production, and treat anything under 70% as a red flag worth investigating. 100% isn't a realistic or even a useful target: cart and checkout pages are intentionally excluded from the cache, so they will always count against the rate. It's also worth checking your hit rate under real load rather than at rest, since a rate that collapses when traffic spikes is one of the most common causes of peak-time slowdowns.
Fill Rate vs Hit Rate: why they're not the same number
It's easy to confuse these two, and mixing them up is a common diagnostic mistake.
Fill Rate is what a cache warmer reports. It's the share of URLs in the warmer's own queue that it considers warmed (cached = 1). You'll see it in the Cache Warmer dashboard and in the Cache Flushes report as "Fill Rate Change" (for example, 87% → 43%). Fill Rate shows how many of the URLs the warmer knows about it considers warm. It says nothing about how many real visitors actually get a cached response.
Hit Rate is what your visitors actually experience: the share of real HTTP requests served from the cache without hitting PHP. You measure it at the cache layer itself: varnishstat -1 -f MAIN.cache_hit,MAIN.cache_miss for Varnish, the $upstream_cache_status field (HIT/MISS/BYPASS) in Nginx access logs, or the X-Magento-Cache-Control header for Magento's built-in FPC.
The two numbers can diverge sharply:
| Situation | Fill Rate | Hit Rate |
|---|---|---|
Warmer has warmed every page, but real visitors arrive with UTM parameters (?utm_source=...) |
100% | Low – the parameters break the FPC cache key |
| High organic traffic keeps the cache warm without a warmer running | 0% (warmer not running) | Can be 85%+ |
| An ERP syncs prices every 15 minutes, faster than the warmer can keep up | 40% | Even lower – real requests hit a freshly-cleared cache |
| Varnish is running in grace mode | Any value | Higher than Fill Rate – grace serves stale content while revalidating |
In our experience diagnosing slow stores, a Fill Rate of 100% next to a Hit Rate of 30% is a routine finding on stores with UTM-tagged traffic that isn't normalized in the Varnish VCL. If your warmer dashboard looks great but your store still feels slow, check the hit rate at the cache layer itself, not just the warmer's own status page.
Unfortunately, Magento 2 does not offer any built-in tools to monitor performance or manage the hit rate indicator.
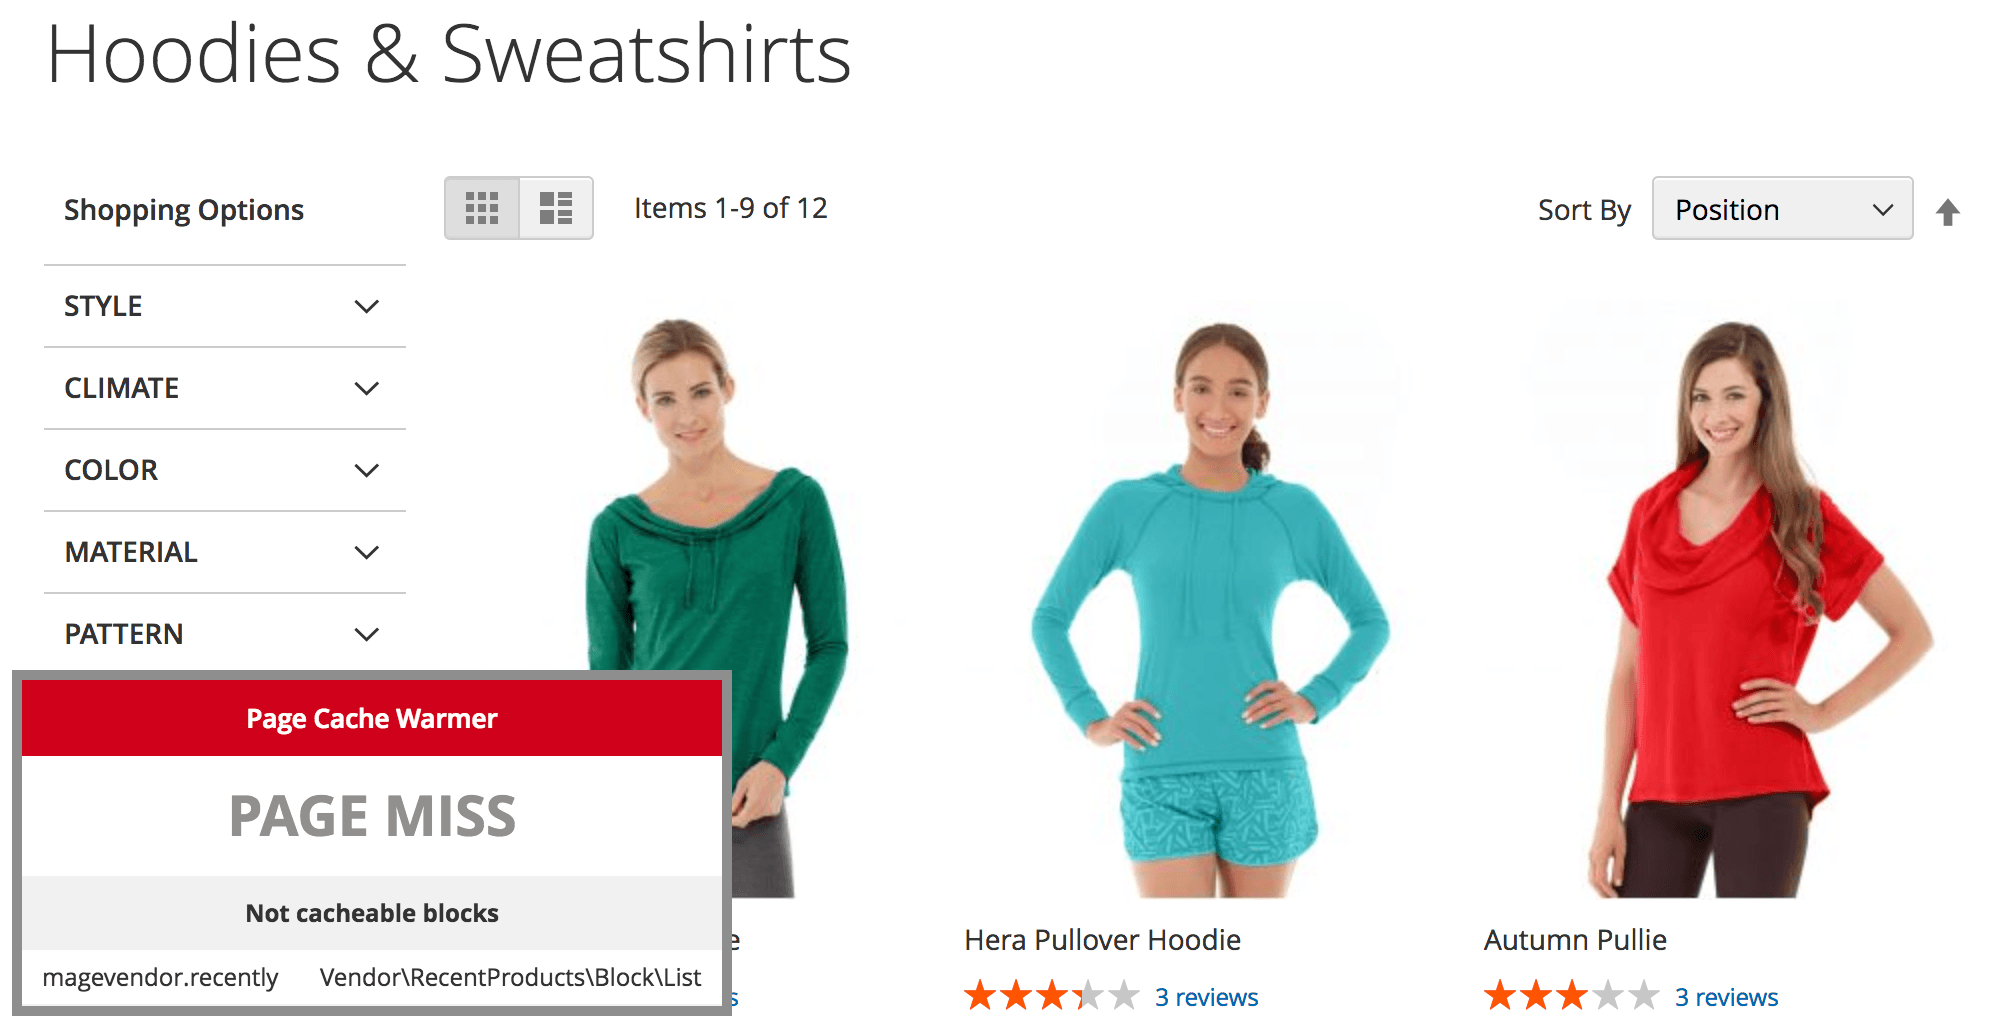
Based on our experience, we have frequently encountered stores where Full Page Cache does not work at all!
This often happens because a popular third-party extension adds a not-cacheable block to the default.xml layout file, and that single block completely disables the entire Page Cache.
We offer two tools for Page Cache management and performance enhancement in general:
- The first is the Page Cache Warmer. Besides all other features, it increases the cache fill rate by proceeding with page warming.
- The second is our extension named Health & Performance Monitoring Suite. It monitors the cache coverage rate (and many others on top of this), and informs users if there are any negative impacts on your store.
For common troubleshooting steps beyond hit rate itself, see our guide to common Full Page Cache issues; for the bigger picture of what caching does for your store, see Magento 2 Cache Management: Benefits, Problems, Solutions.
Head of Product at Mirasvit
Magento 2 store loads quickly only if its pages are in the cache. Our extension automatically adds pages to the cache and thus, speeds up your store!
Whenever your customer or Google visits a page, its most recent variant will be loaded in a fraction of a second from the cache.
This extension runs an automated crawler that monitors cache status. Once the cached page is cleared, the crawler visits this page and warms up the cache for it!
The Extension monitors code and configuration changes of your store, and automatically notifies you if these changes have negatively affected the key store indicators. If you change anything and find that either your store begins to work more slowly, or you suddenly experience new errors occurred, the extension will quickly notify you about it.
Keep Learning
![7 essential ways to improve your Magento 2 site speed [Updated]](https://mirasvit.com/media/blog/resized/989/magento-performance-.png)