Magento 2 Web Analytics: Select the Right Tracking Stack
-
 Oleksandr Drok
- E-commerce Tips & Best Practices
- Sep 9, 2025
- 13 min read
Magento 2 web analytics helps you understand how visitors behave in your store, what influences their purchase decisions, and where to find growth opportunities. However, the platform does not provide advanced data collection or analysis out of the box, and a basic GTM + GA4 setup often fails to meet real business needs.
If you want to see the full picture from the first visit to purchase and know exactly how to adjust your pages or funnel, you need a carefully planned set of tools for tracking and researching user behavior.
In this article, we explain what types of tracking and analysis exist, how different services compare, how to combine them effectively, and where to start if you are just getting started. All recommendations are based on our hands-on work with the platform and real client cases and reflect Magento 2 analytics best practices.
Table of Contents
- Going beyond Magento 2 GA4 integration: why you need more than GTM + GA4
- Choosing your stack: selecting the right tools for your store
- Understanding on-page behavior: Hotjar, Clarity, and similar tools
- Combining your stack: Magento 2 tracking setup guide
- Conclusion
Going beyond Magento 2 GA4 integration: why you need more than GTM + GA4
One of the baseline tools for tracking on-site events that people mention first in e-commerce analytics is Google Tag Manager (GTM). On its own, however, it does not provide insights. It is essentially a bridge between Google Analytics and your site. Why isn’t that enough?
First, Google Analytics has changed in recent years and has become a more technical platform, which can be hard for a non-expert to navigate.
Second, GA is designed for Magento 2 real-time analytics, showing traffic levels, where people come from, and what actions they take (product view, add to cart, purchase).
You can review a funnel or the conversion rate (how many users arrived, how many added to cart, and how many purchased), but that is often not sufficient for a deeper understanding.
If you need additional reports, such as retention, they are not available out of the box.
Google Analytics also does not offer a convenient way to see retention, that is, who returns and how often. For stores that sell everyday consumer goods, this is critical.
You cannot build custom formulas either, so if you want to calculate a ratio between two events, you have to do it manually in Excel, for example.
Another aspect of GA4 is that it shows only aggregated metrics and events. You see headline numbers (users, sessions, traffic sources, conversions, e-commerce metrics) and the custom parameters you configured.
At the same time, the service intentionally hides personally identifiable information (PII), full IP addresses, precise individual paths, and small samples. This means you do not have direct access to raw logs, and you get a segment-level view instead.
While other tools (for example, Mixpanel or Amplitude) also comply with privacy requirements and do not expose PII, they allow you to export events in a more granular format.
You can work with each recorded click or action and build your own reports or formulas. This significantly expands what you can do with behavior analysis and experimentation.
Choosing your stack: selecting the right tools for your store
Everything depends on your stage of growth, traffic volume, and specific goals. If your focus is SEO, meaning driving visibility, Google Analytics is usually enough because it is built for that use case.
If you are starting to analyze the sales funnel or improve conversion rates, you need a different tool that is tailored to those tasks.
If you care about page-level UX and want to see how each user clicks and scrolls, you need heatmaps and session-recording apps that show how a visitor moves through the store.
At the very beginning, most stores care mainly about traffic. Even with weak UX, two to three percent swings in sales will not change the picture much, so investing in heavier analytics will not pay off yet.
For a mid-sized store, all directions become relevant. You work on SEO, customer behavior, and specific interface elements in parallel.
For larger e-commerce operations, you do not optimize the entire site at once. You focus on specific areas. A team might own two or three components, run experiments or tests, and use different tools to do this effectively.
Universal analytics platforms exist, but the more universal a tool is, the fewer options it offers for narrow, specific cases. Or it tries to do everything and becomes hard to use. It is more practical to pick different tools for different jobs.
In general, most stores need three core layers:
- Analytics.
- Customer behavior, that is, event-based product analytics.
- In-page analytics that show how a user behaves on a specific page.
The first is covered by GTM + GA, the second by Mixpanel or Amplitude and their alternatives, and the third by Hotjar, Clarity, and similar services. In practice, you will run these in parallel as complementary visitor tracking solutions for Magento 2.
There are dozens of alternatives, and you can try the ones you prefer. Even if you do not need a specific feature today, you do not have to turn it off. These tools can quietly collect data for a year or two, and when something happens, you can review history and compare changes.
Once you decide what you need, you can implement a specific tool.
Example. You run a mid-sized business and set a goal: increase the conversion rate by 10 percent so that sales and average order value rise accordingly.
Where do you start? Sell more. How do you sell more? Encourage shoppers to explore similar products and add them to the cart. You already have a recommendations block, but it doesn’t seem to work. Are you sure? How can you verify it?
Use Mixpanel to see how many clicks that block receives from specific pages. Establish a baseline, then improve it step by step. Small changes can move the overall numbers.
At this point, when you decide to solve problems through measurement, you usually need an analyst, or even a small team if there are many questions. It is hard for a generalist marketer to go deep enough.
You may also need a developer to set up a specific platform, though usually not full-time. In many cases, a few lines of code are enough to start tracking the right events.
By the way, with our GTM module you can simplify the setup. After a few small code changes, it will work with Mixpanel as well. And if you want to skip the code entirely, our Magento 2 Mixpanel extension streams store events into Mixpanel automatically after a one-time install.
Next, we will look at these and other tools in more detail.
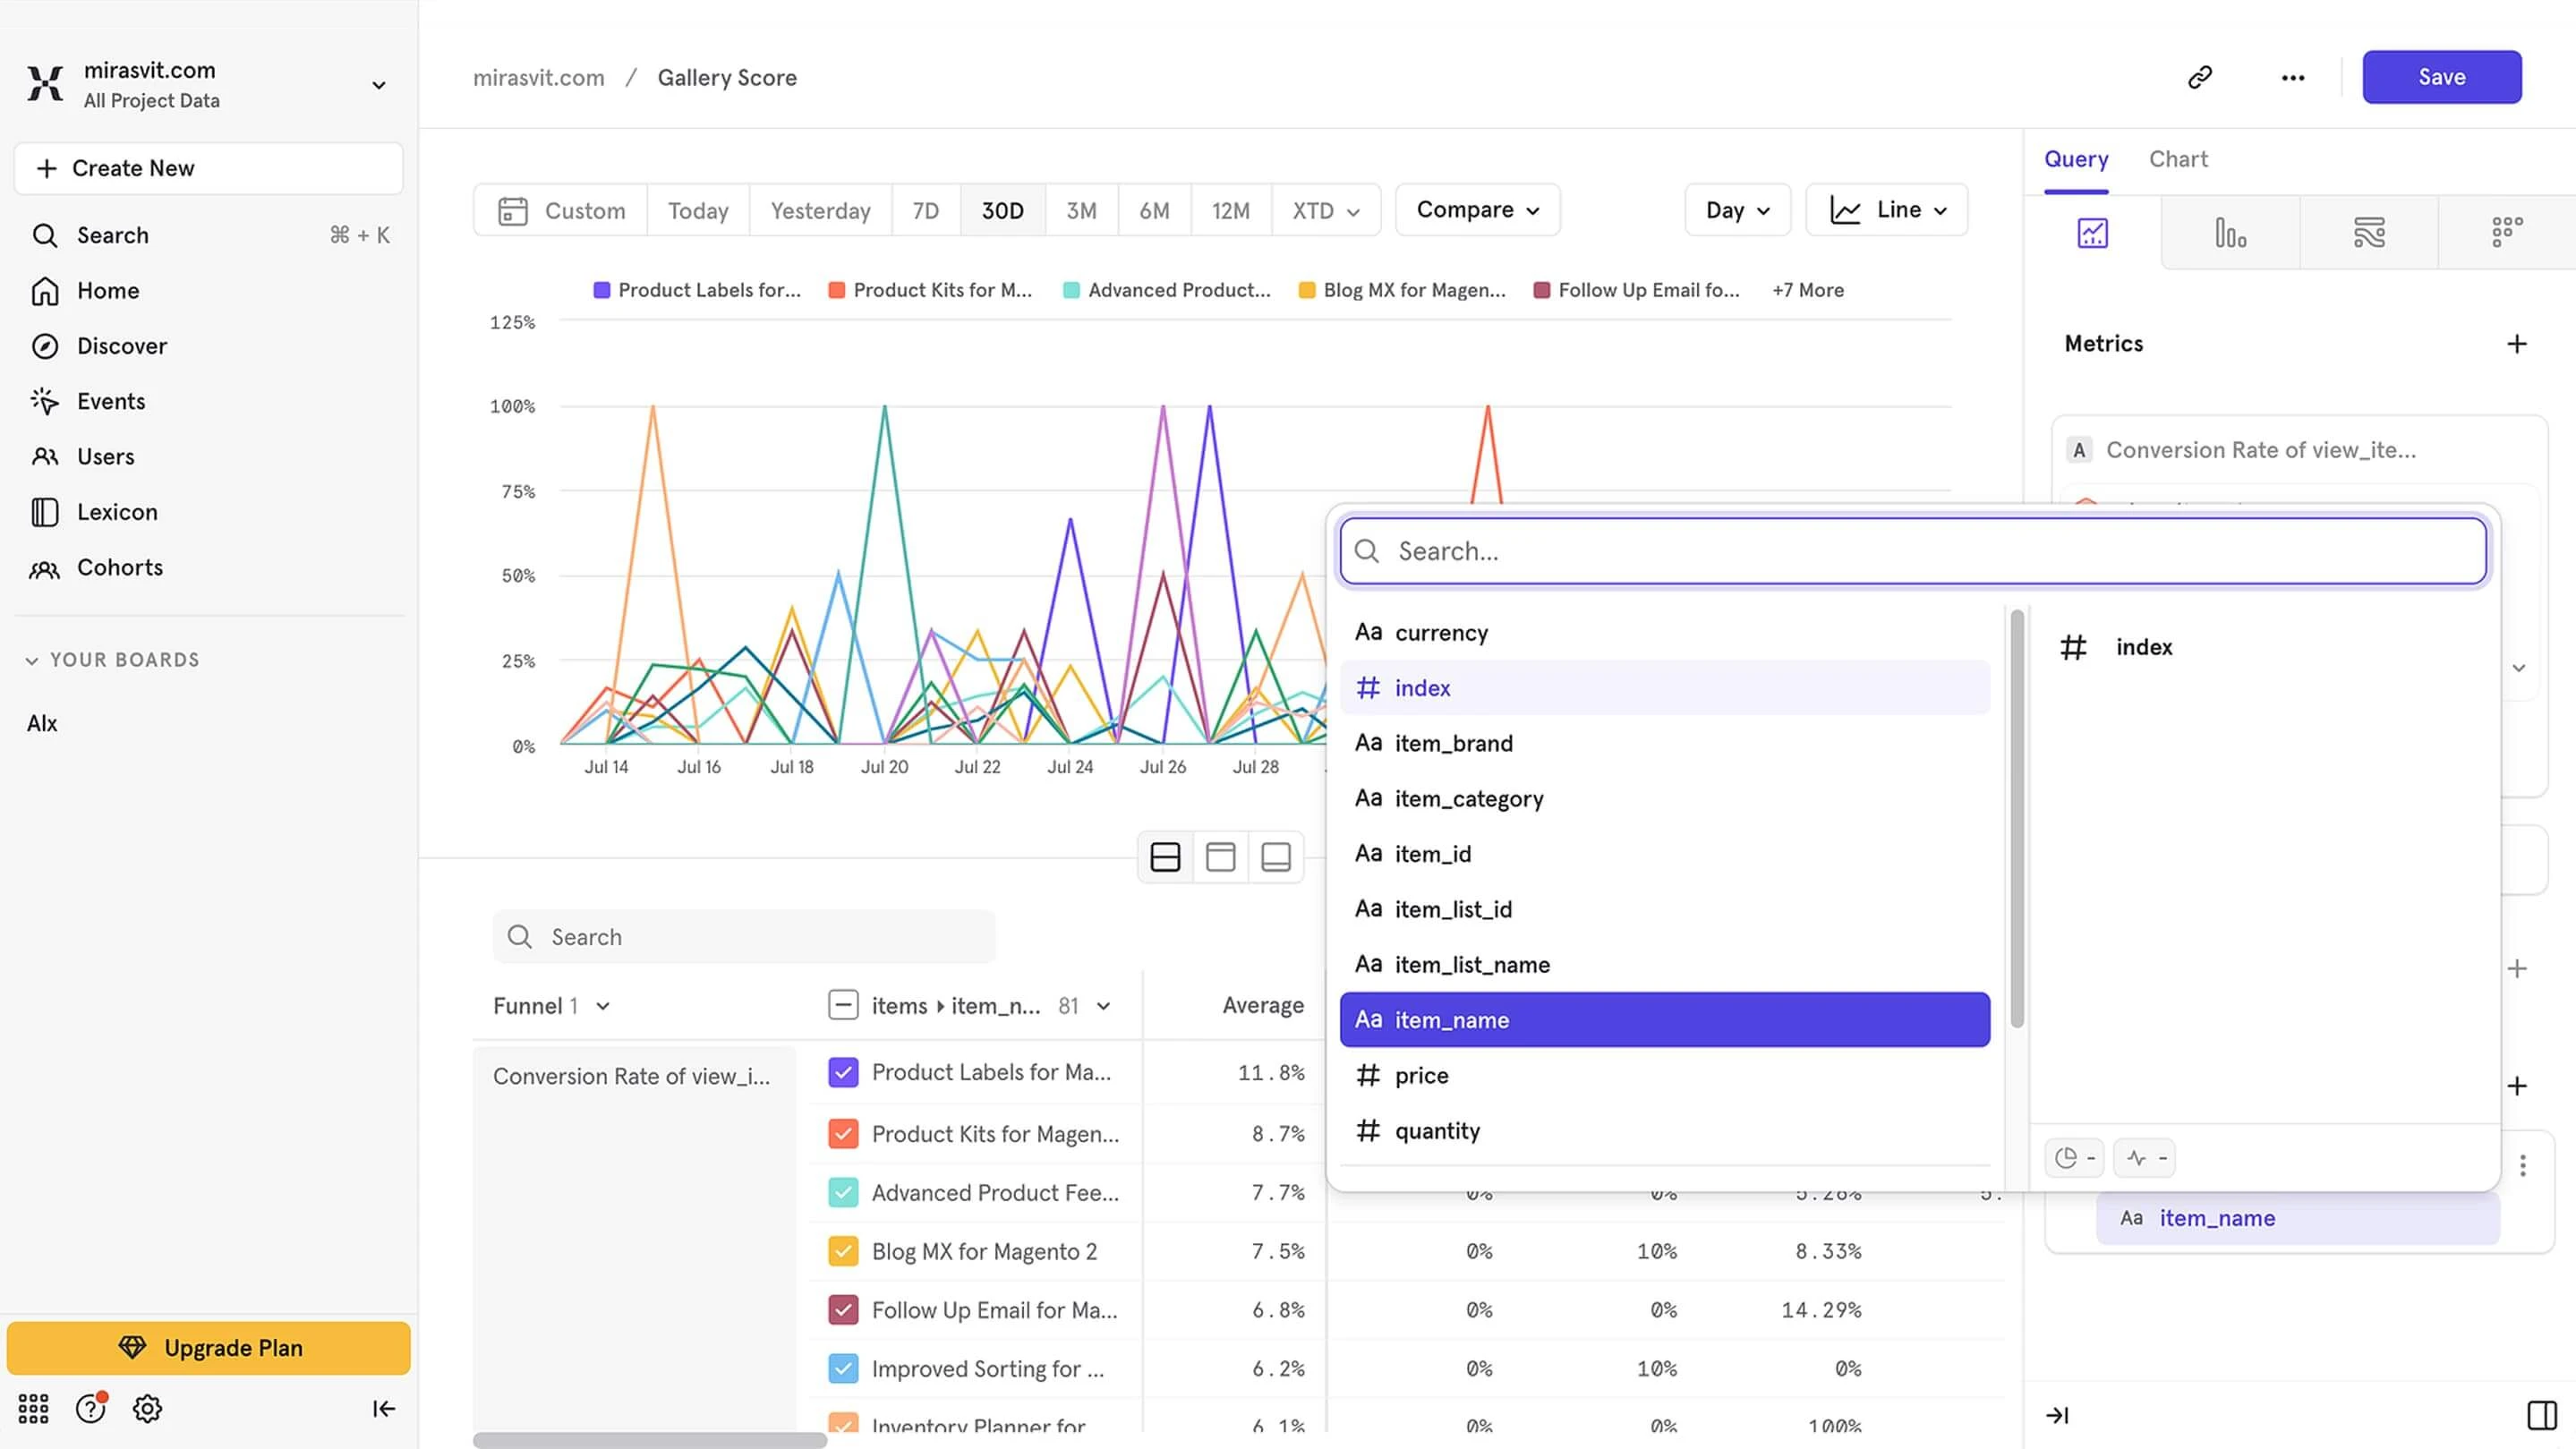
Using Mixpanel and Amplitude: enhanced e-commerce tracking for Magento 2
Mixpanel and Amplitude are event-based analytics tools. They let you go beyond simple event logging and build flexible, detailed reports from those events. They are commonly used for Magento 2 customer behavior analytics. To wire Mixpanel up to a Magento store without custom development, you can use our Mixpanel integration for Magento 2, which tracks ecommerce events and stitches them to logged-in customers out of the box.
For example, you can easily measure the time between a user’s first visit and the moment they place an order. With the right configuration, you can also see the average time by product, by category, and so on.
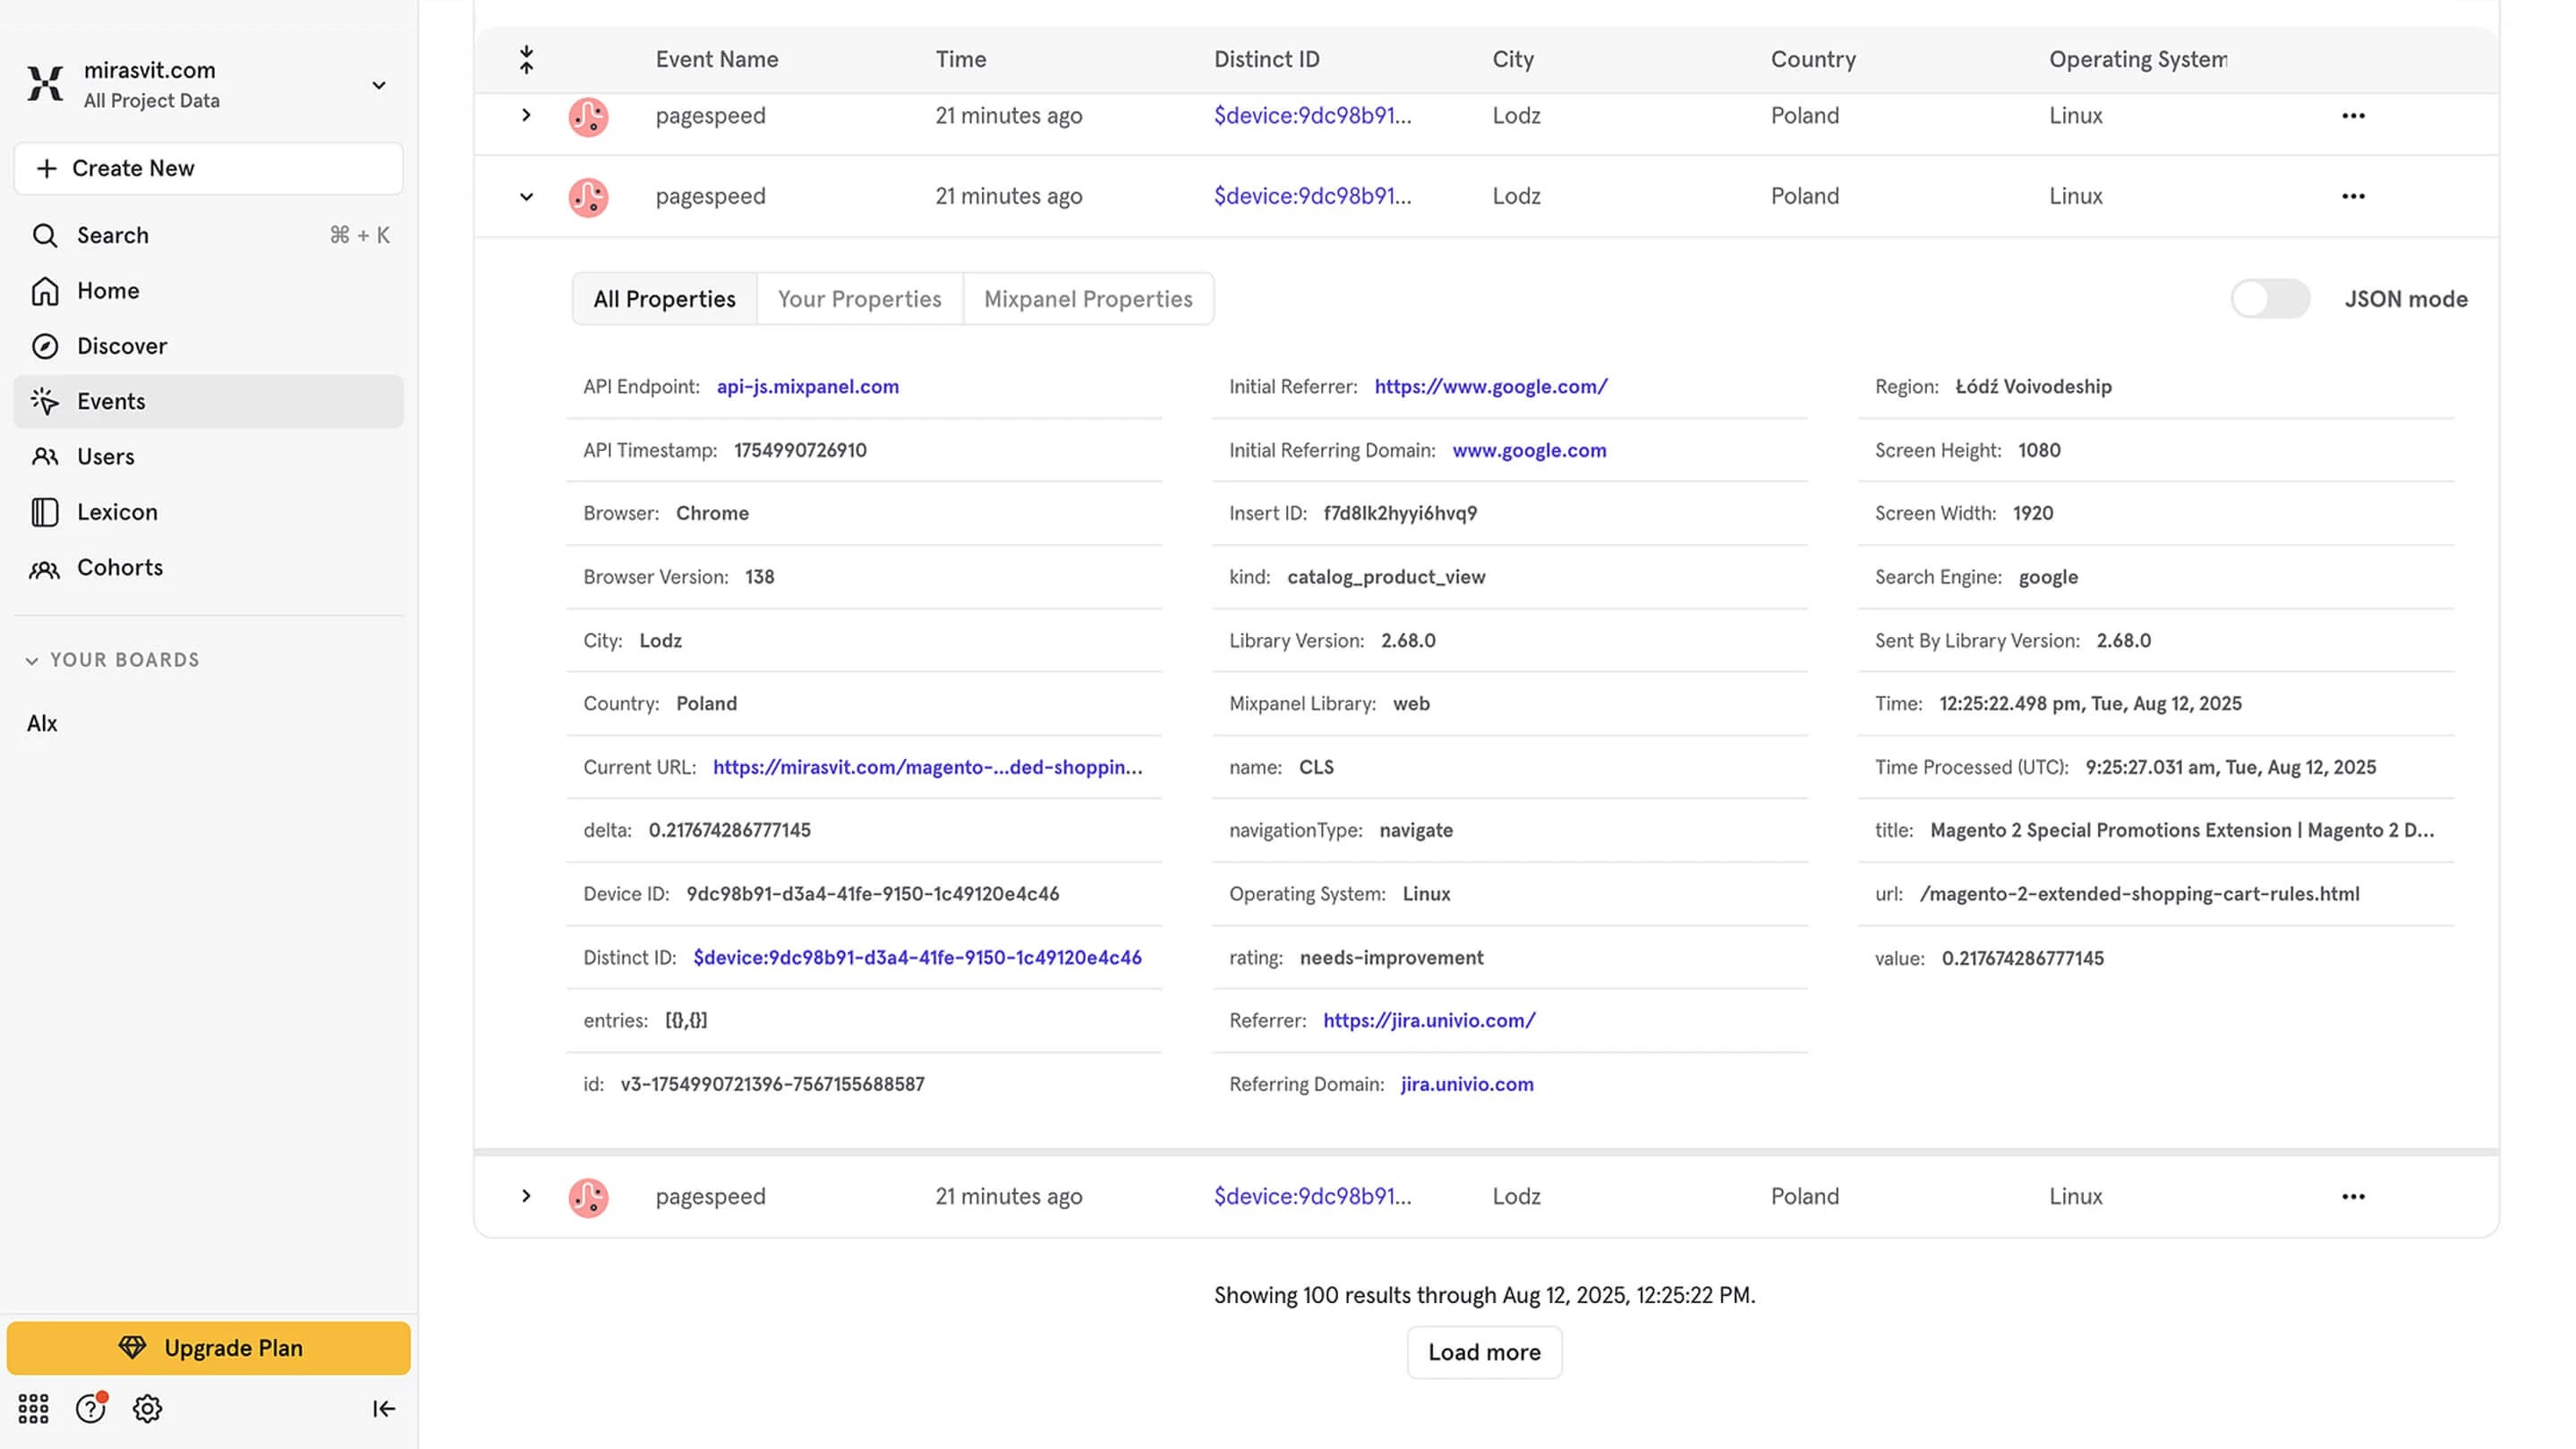
Additionally, unlike a GTM + GA setup, Mixpanel provides access to raw, event-level data, not only aggregated reports. You can export the full stream of events recorded on your site at any time and work with them directly.
For example, using this approach, we calculated the share of visitors who read our blog and eventually placed an order. The goal was not to look only at last-click traffic from the blog.
The analysis included any path where the blog appeared in the funnel: a user viewed a product, returned two days later to view another product, read a blog post three days after that, and completed a purchase three days later.
You cannot build that specific report in Mixpanel itself, but the tool lets us export all site events and compute the ratio we needed. In other words, we could see which specific posts were involved, which specific orders were placed, and in what sequence.
Google Analytics does not provide direct access to raw event logs because the data is aggregated. Let’s look at a few useful cases for Mixpanel/Amplitude.
The first, simplest one is measuring the impact of specific blocks or buttons on purchases. How many buyers clicked this button, how many read the Refund Policy, or how many viewed reviews? This helps you decide whether a block should be removed.
A second common scenario focuses on what happens before an order. Mixpanel lets you see how long it takes before a purchase and which pages were viewed. You can build segments by pages or by customer groups and, for example, see that partners place orders more often from certain categories on specific days.
To sum up, with Mixpanel/Amplitude, you can:
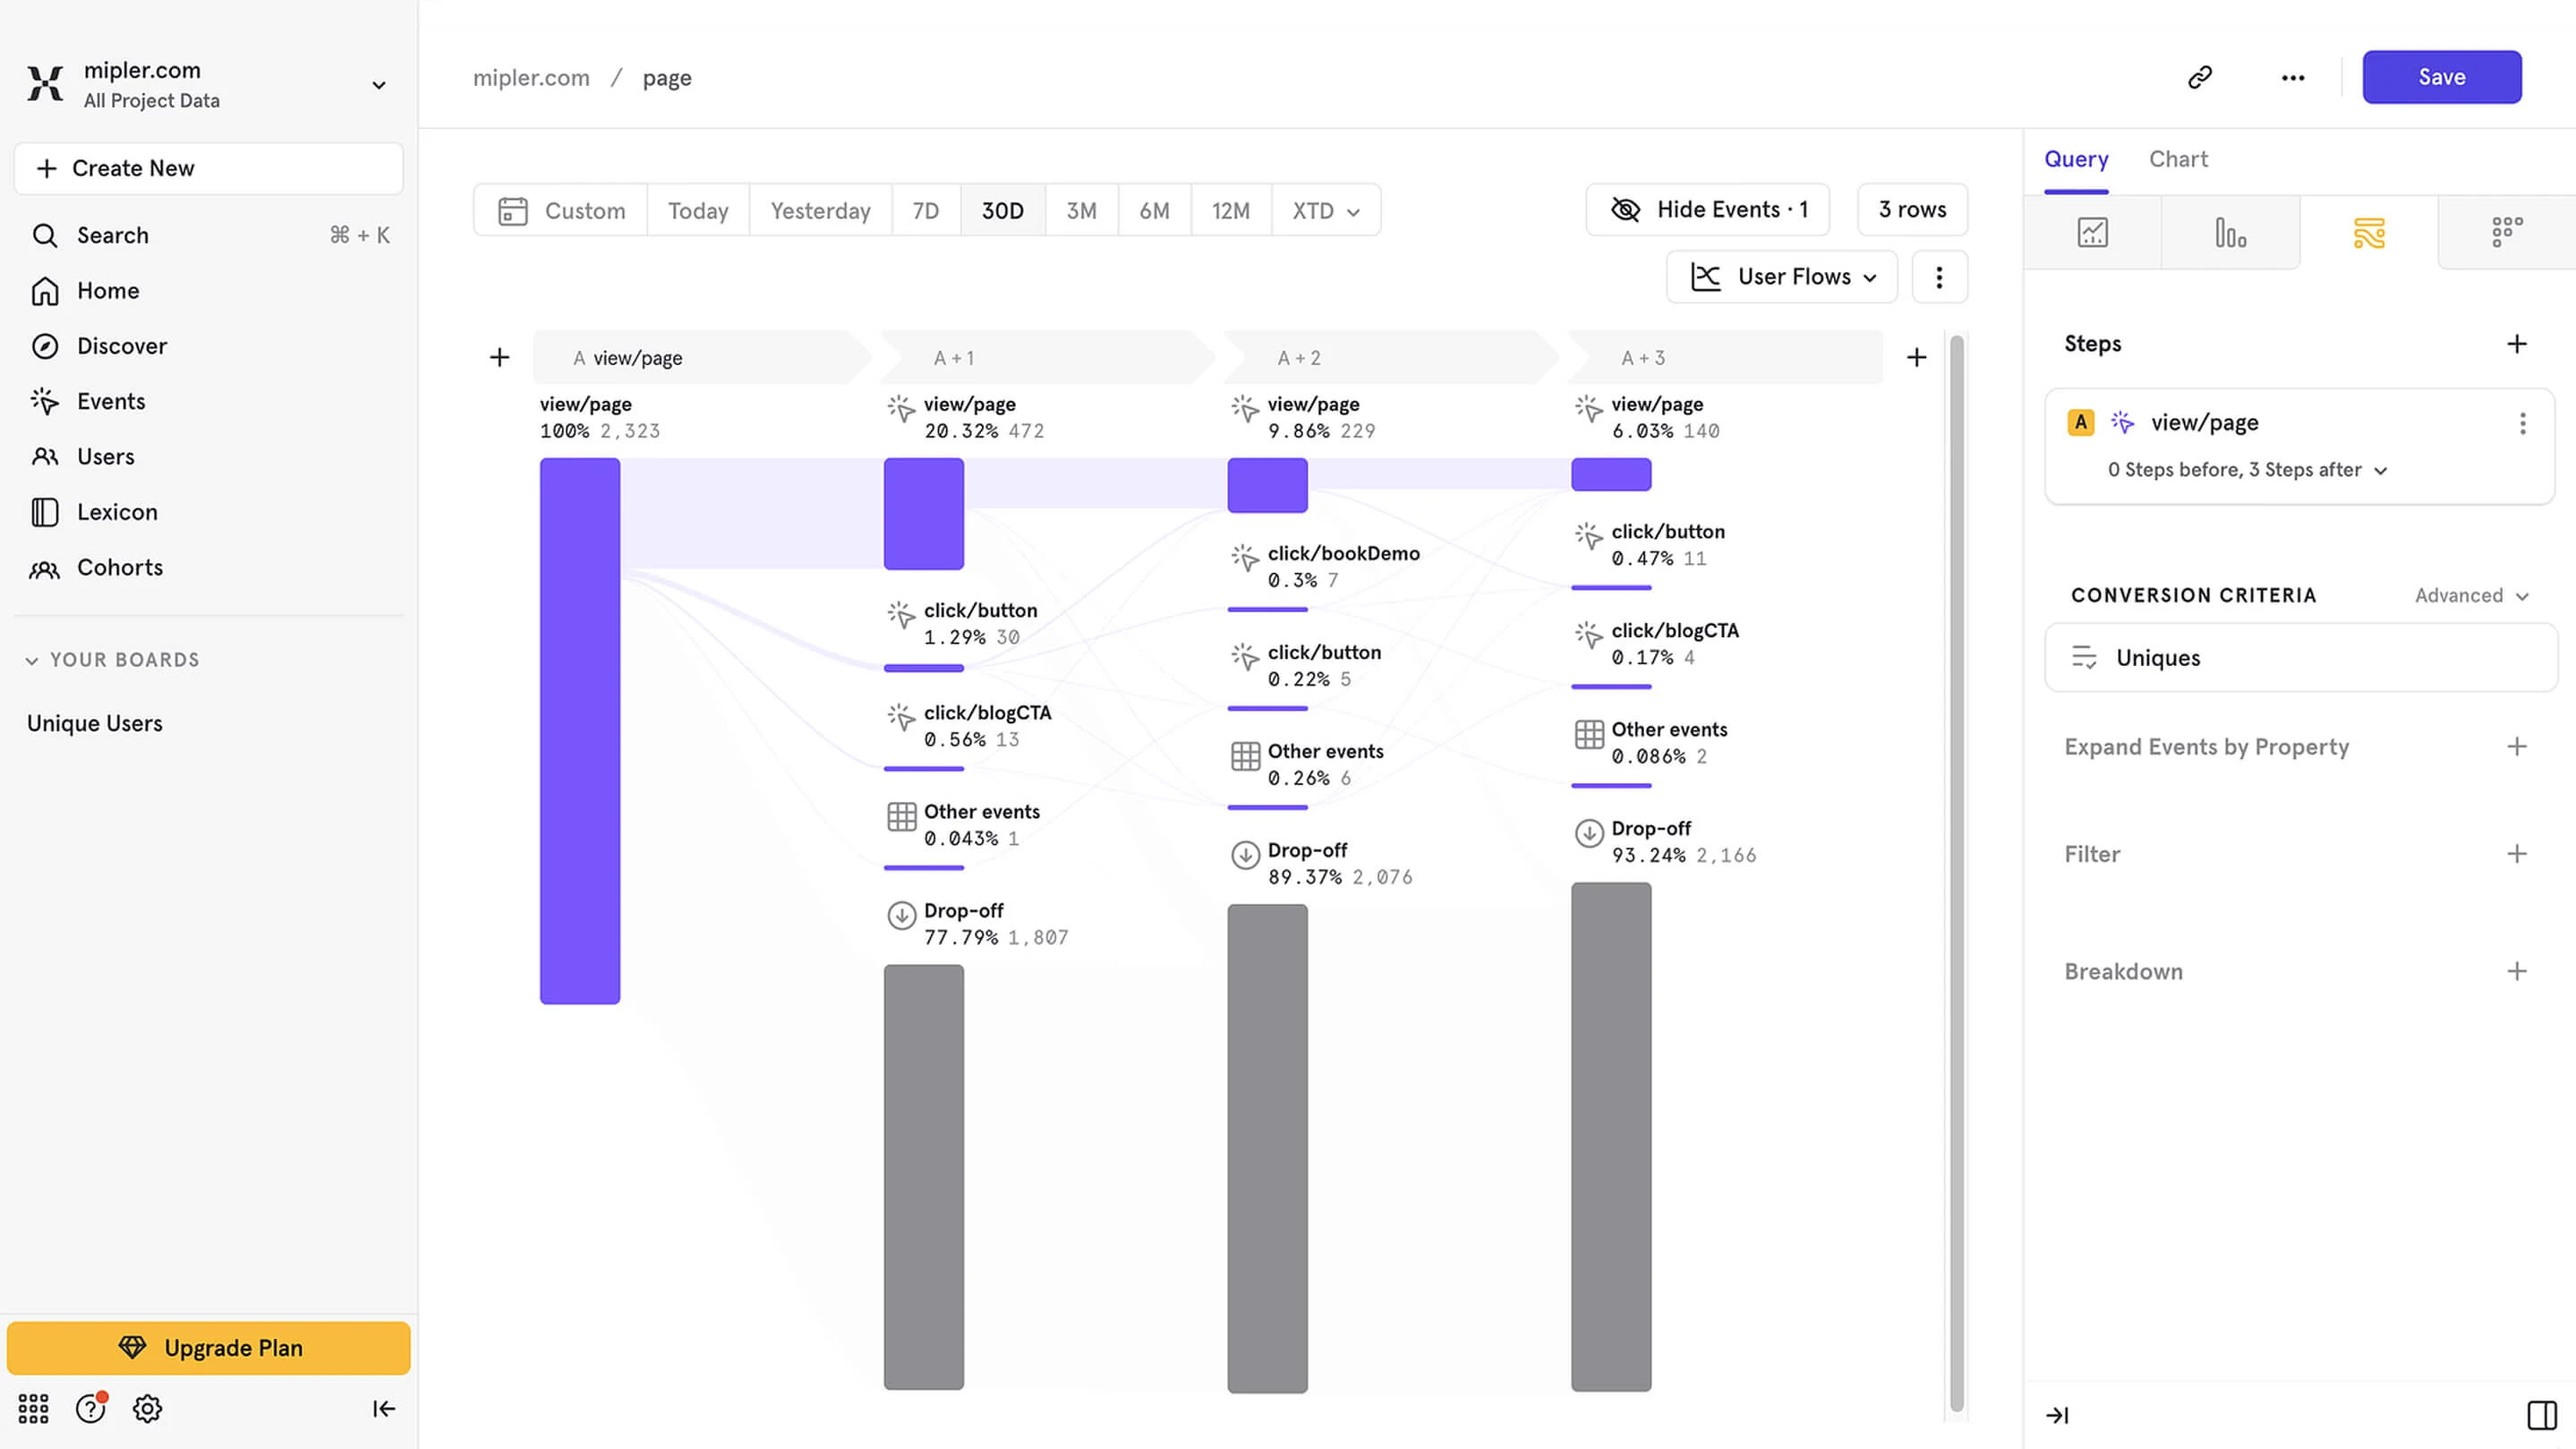
- Build funnels, for example, the path from viewing a product to placing an order.
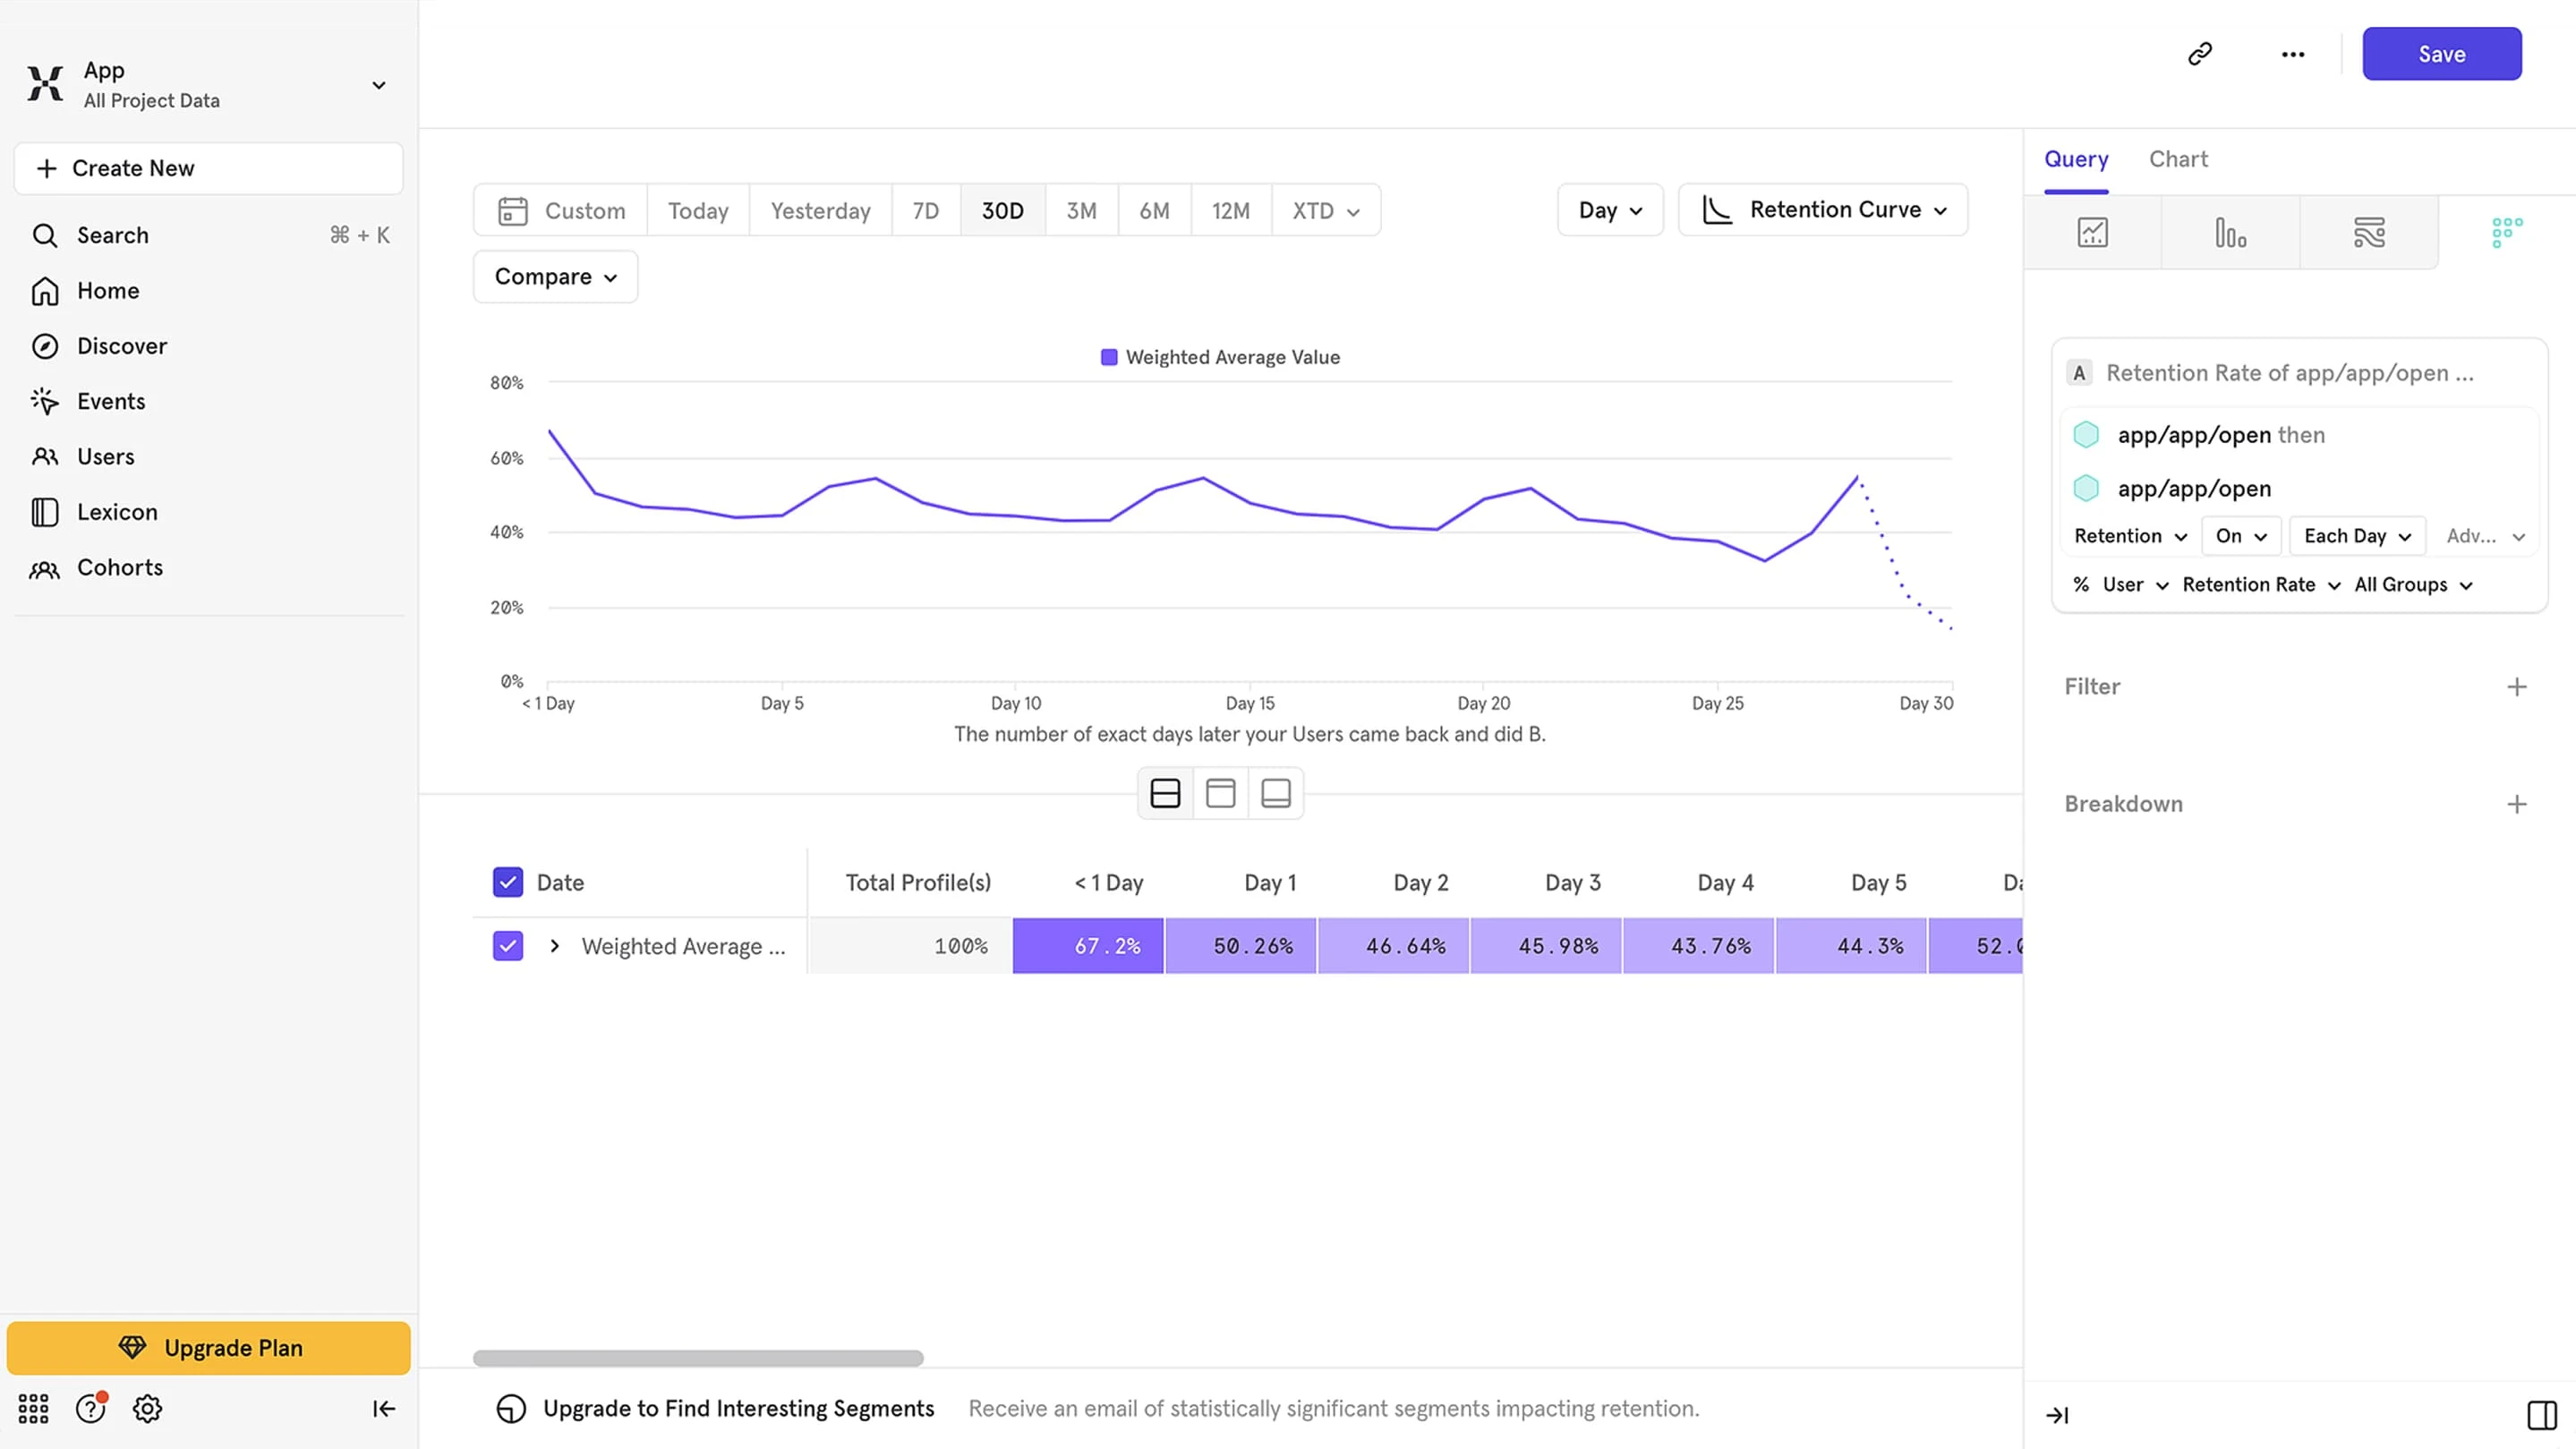
- Analyze retention, that is, how often users return and how frequently.
- Compare behaviors, for example, how watching a video affects the likelihood of purchase.
- Segment users by actions, for example, who clicked a specific button but did not complete a purchase.
Understanding on-page behavior: Hotjar, Clarity, and similar tools
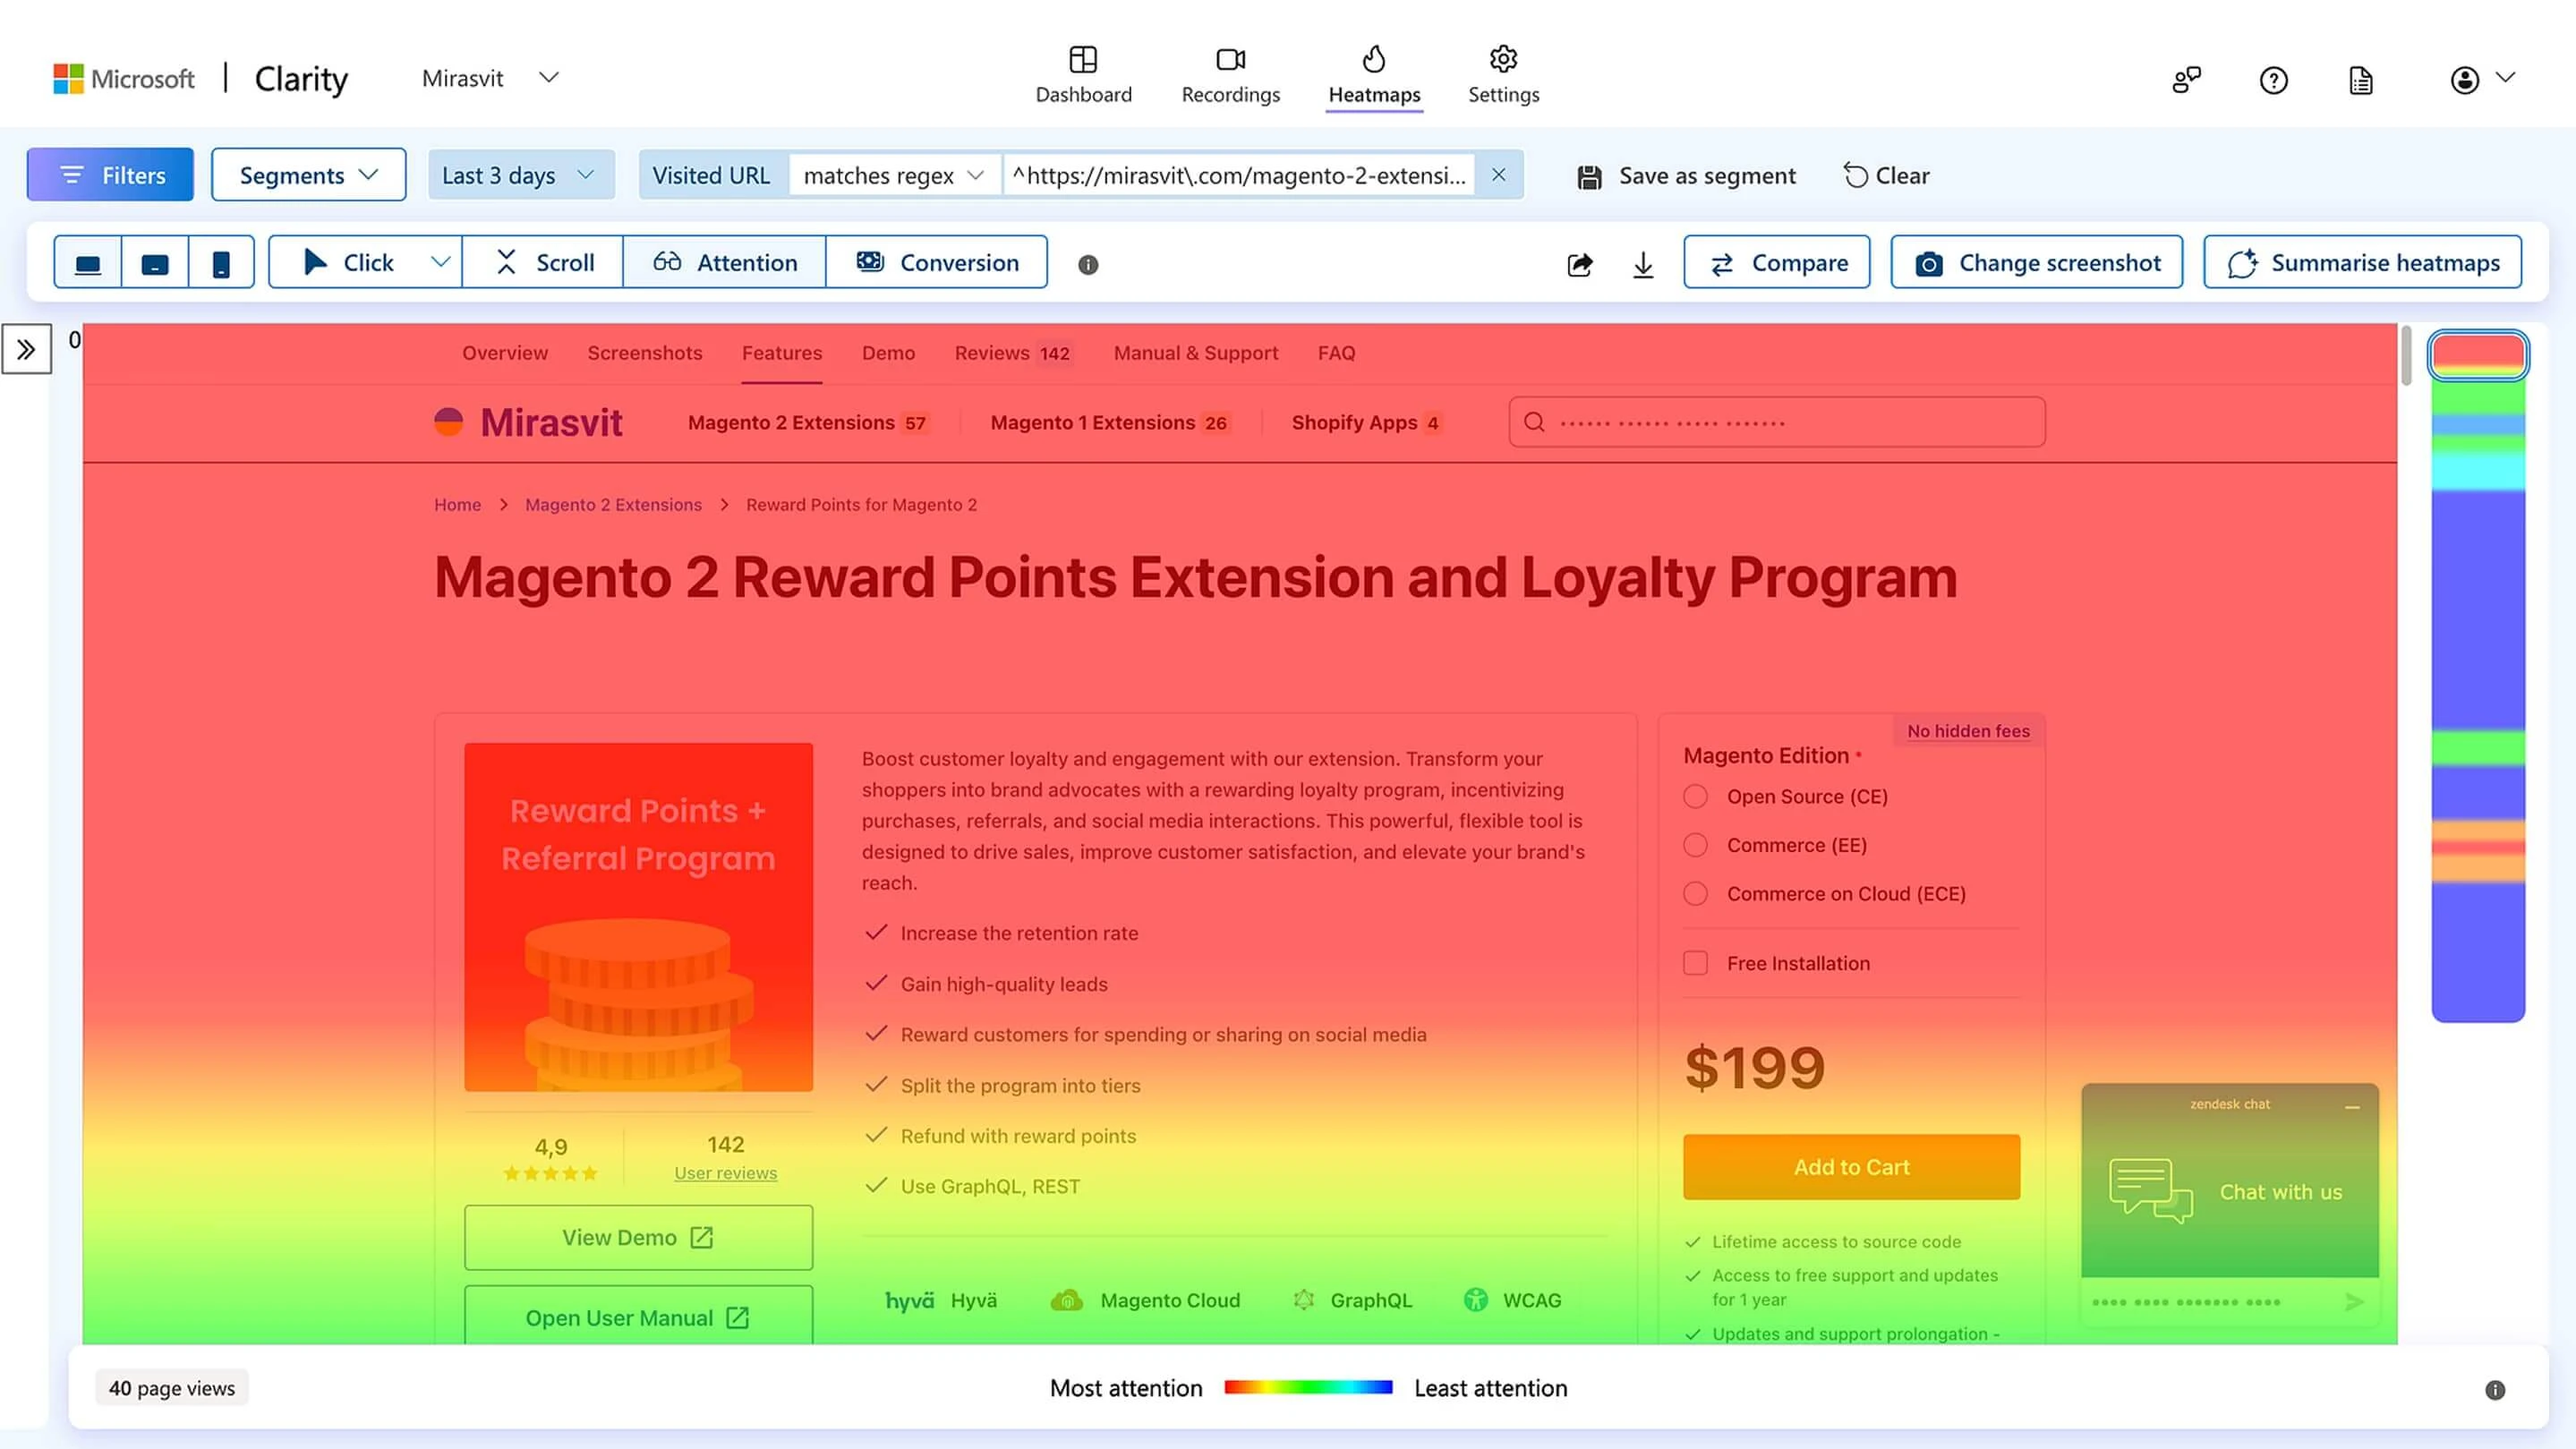
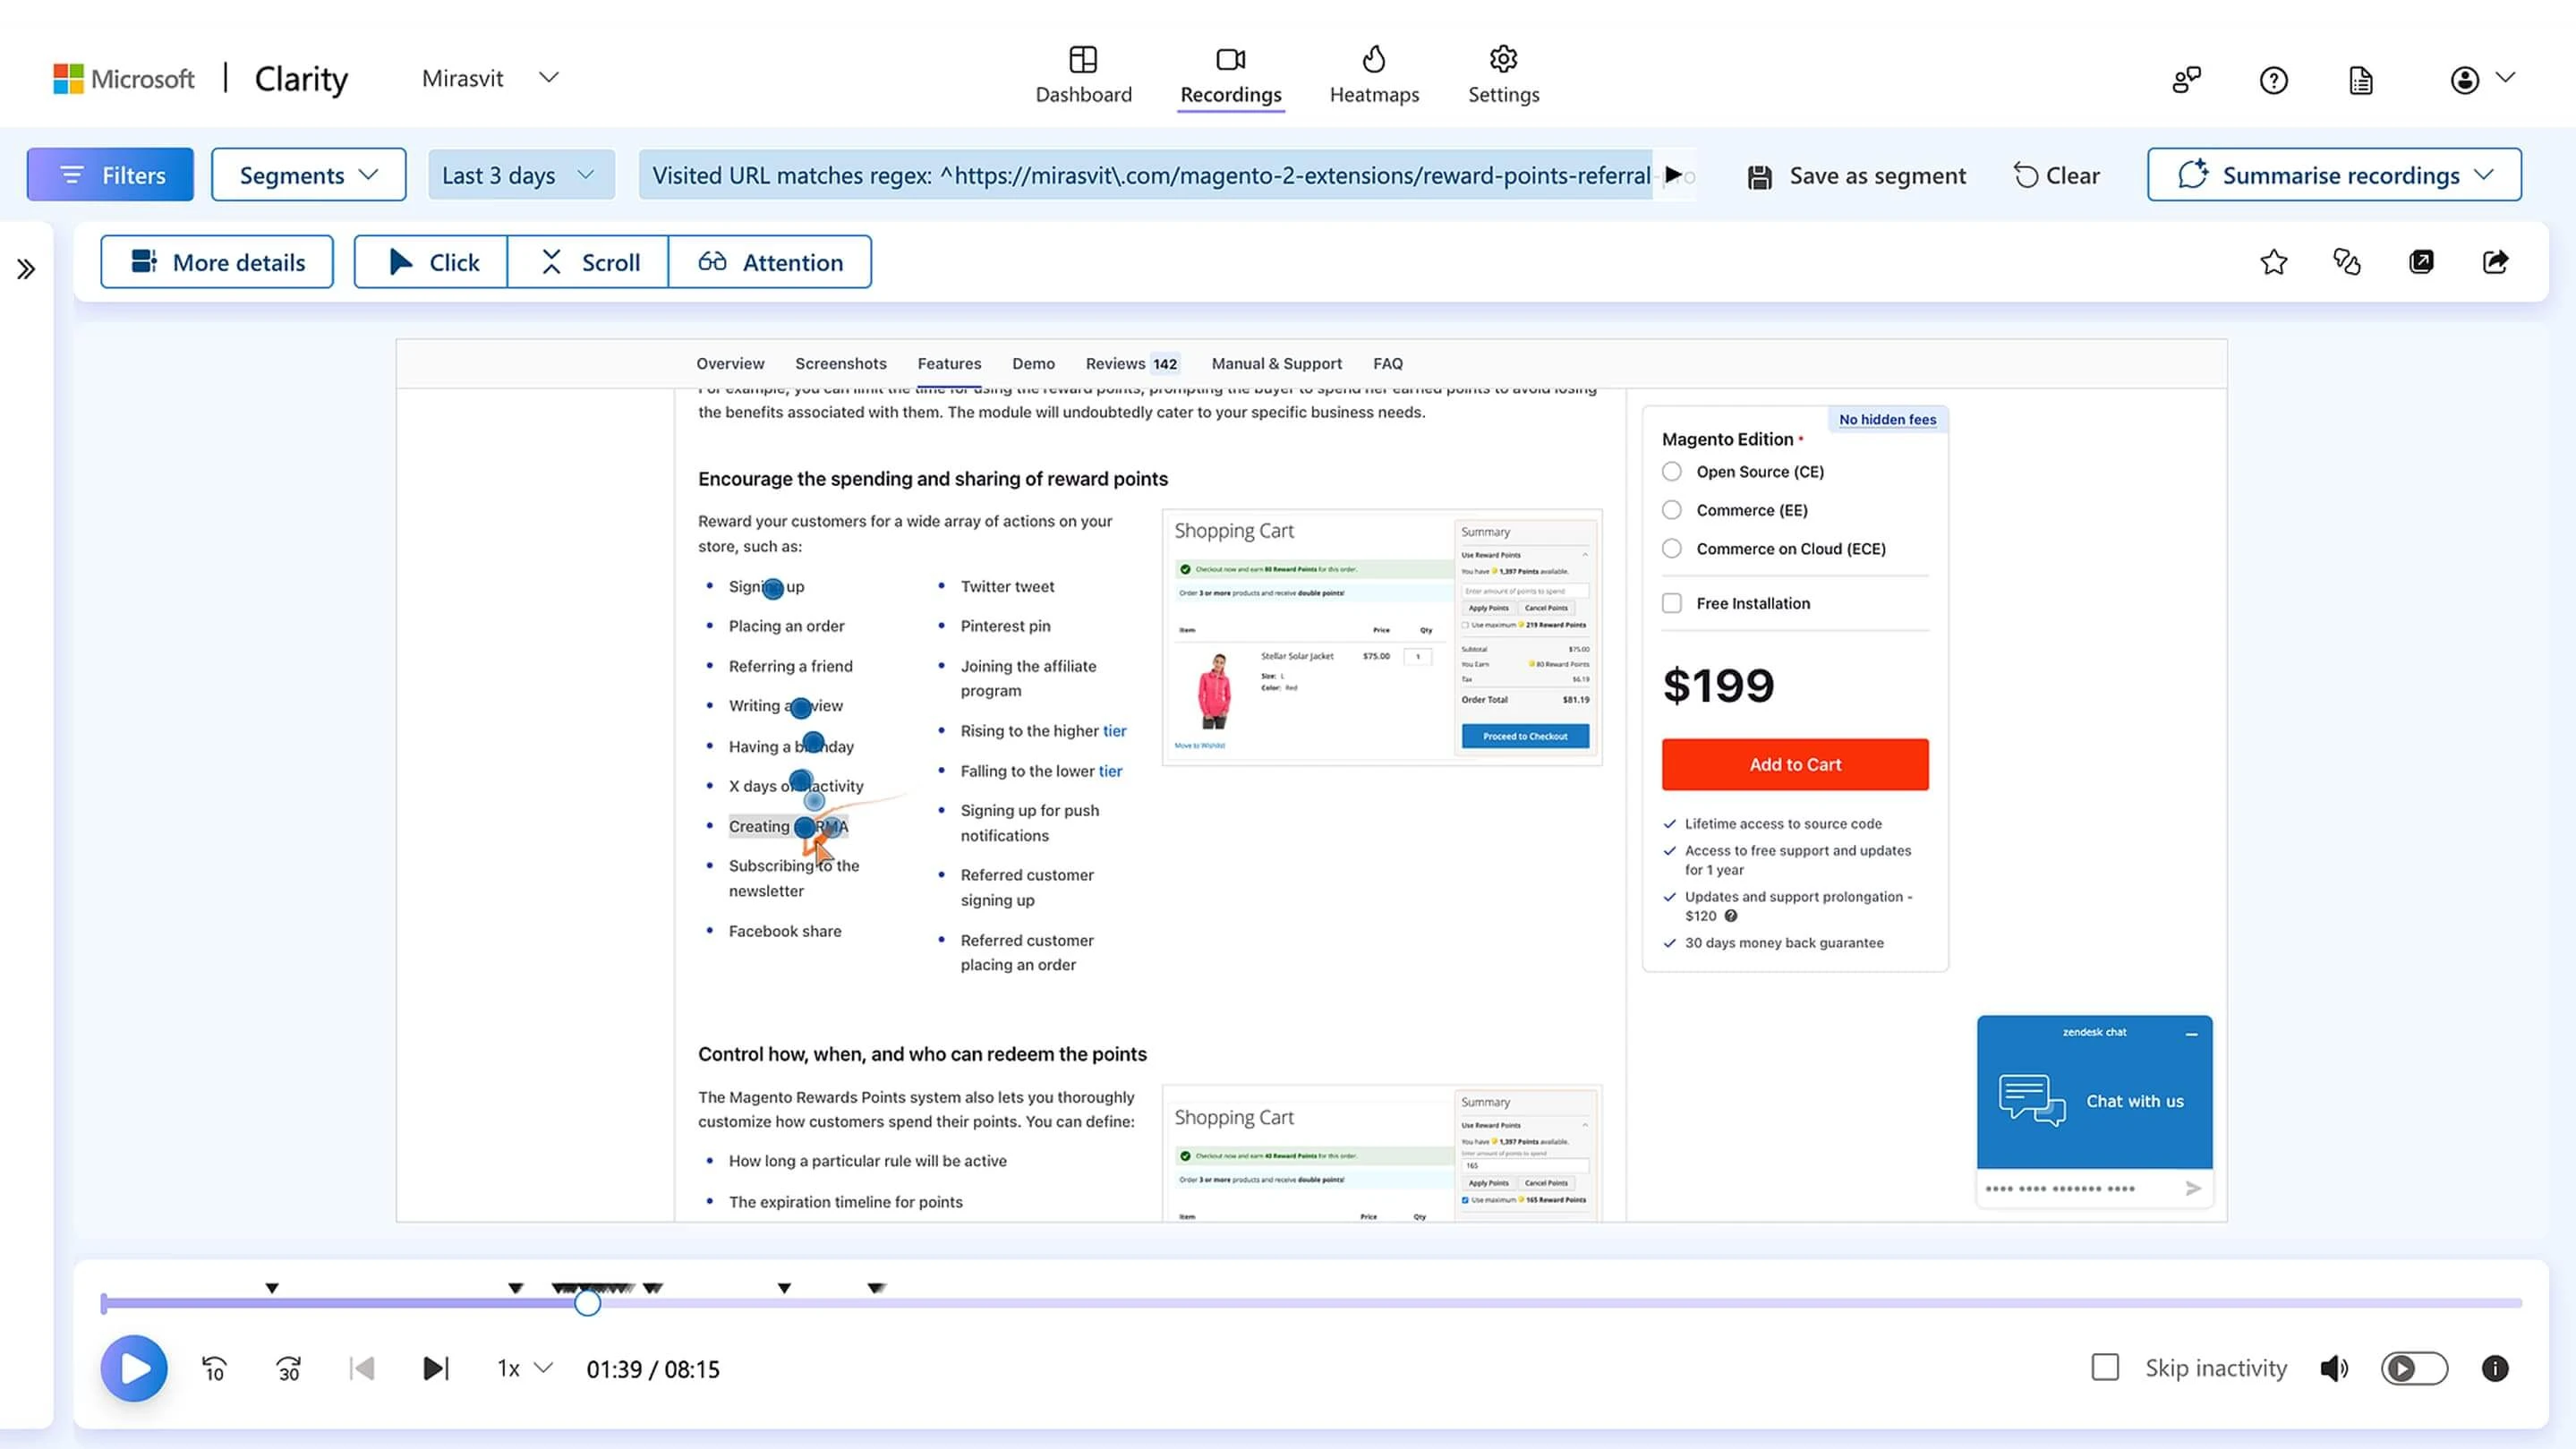
Tools like Hotjar and Microsoft Clarity show how users behave on a page: where they click, how far they scroll, and which elements distract them. Session recordings, heatmaps, and click maps are the raw inputs for Magento 2 performance analytics, revealing how people move between screens, where they pause, and what they ignore.
In essence, we are already talking about different levels of detail.
You have high-level analytics (you know how many visitors you had), a more detailed view (you know which actions those visitors took), and, finally, a granular level where you analyze each individual visitor.
You get session recordings that show how a user moved through your site, where they moved the cursor, where the mouse lingered, and so on. From this, you can learn a lot.
First, check whether the customer can easily find what they need in your store. If they start clicking randomly on various icons and buttons while searching for information, that is an early signal that something is off. If many visitors behave this way, there is clearly a problem.
Second, you can track display issues. This is useful because customers use different screens, devices, and operating systems. When bugs appear, you can spot them quickly with tools like Hotjar or Microsoft Clarity.
We have done this kind of research ourselves, documenting how people use our site. Yes, it takes time, but if you have drilled down to this level, it usually means higher-level analytics did not give you the answers. You have already exhausted them.
In addition, in-page tools let you focus on something specific. For example, you can see how users interact with a new block you added. You can configure events, filter only the recordings that contain that event, and jump to the exact segment where it starts.
A strong signal that you need in-page analytics is a high number of abandoned carts, or worse, abandoned orders. People reach that step, then something happens. What exactly?
This is where low-level user analysis helps. You may see someone enter their first and last name, then abandon the form at a specific field. What is wrong with it? You investigate and fix it.
You keep going deeper. Suppose Mixpanel gives you a very detailed view of your funnel: how many users viewed a product, how many added it to the cart, how many reached checkout, and how many purchased. You consider which stage you can improve, then bring in in-page analytics to understand what to change.
Even if your store is still small and you know sales should be higher, you may have tried everything and still cannot find the reason. In-page analysis can provide the answer.
If you have around 100 visitors per day, you can review all of them and spot a pattern or an anti-pattern. Maybe the issue is the description. People read it, and at a certain paragraph most close the page or scroll back up. Any user action that deviates from the intended path is a signal that something is off and worth investigating.
To sum up, with Hotjar or Microsoft Clarity, you can:
- Observe on-page behavior: clicks, scrolling, and mouse movements.
- Analyze interactions with specific elements: buttons, blocks, and forms.
- Identify usability issues: confusion, erratic actions, and long searches for information.
- Catch display and technical issues across different devices and browsers.
- Find critical funnel points, such as fields or steps where users drop off.
Combining your stack: Magento 2 tracking setup guide
I recommend starting to collect data from the first day of your store. Define what you want to track, what matters to you, and set up the necessary tools.
While you are small, most of this will be free, and you will already have history for analysis. When the time comes, you will be able to compare how things were and how they changed.
In real projects, we rarely see only one tool in use because e-commerce data analytics for Magento 2 typically requires multiple layers: GA4 for reporting and ad campaigns, Mixpanel for behavior analysis, and Hotjar for session replays.
Scenarios for using the Magento 2 web analytics stack:
- GA4 + Mixpanel: combines marketing reporting with deeper behavioral analytics.
- GA4 + Hotjar/Clarity: marketing data plus session replays for UX analysis.
- GA4 + Mixpanel + Hotjar: a complete stack that covers most store needs.
In some cases, you can add Amplitude if your team is used to it, or other products when you need to build complex reports that run on your database.
Compare analytics combinations by strengths and use cases:
| Combination | Description | Strengths | When to use |
|---|---|---|---|
| GA4 + Mixpanel | Combines marketing reporting with deep behavioral analytics. | Full view of traffic and channels; detailed event analytics; user segmentation. | When you need to analyze traffic sources and on-site behavior across funnels. |
| GA4 + Hotjar/Clarity | Marketing data plus session replays for UX analysis. | Clear view of how users interact with a page; identify UX issues without heavy integration. | For UX audits, testing design hypotheses, and quick qualitative insights. |
| GA4 + Mixpanel + Hotjar | Full-stack covering most online-store needs. | Combines marketing, product analytics, and UX research; a complete view from traffic source to on-page action. | When you need maximum control over funnels, user behavior, and interface usability. |
| GA4 + Amplitude | Marketing data combined with powerful product analytics. | Strong cohort analysis and retention reports; handles large event volumes well. | When you need deep customer lifecycle analysis and long-term retention metrics. |
| GA4 + Clarity + Mixpanel | Marketing reporting + behavioral analytics + session recordings. | Blend of quantitative and qualitative data; full journey from traffic source to on-page interaction. | When you need numbers and context to optimize UX and marketing. |
General recommendations based on our experience that reflect Magento 2 analytics best practices:
- Start with questions, not tools. Decide exactly what you want to learn.
- Do not roll out everything at once. Start small with GA4 and GTM.
- If you are not sure you need Mixpanel, try the free plan or log a few key events manually.
- Analyze behavior before making changes. Heatmaps and session recordings often reveal more than numbers.
- Always test your hypotheses. Only then will analytics become a growth tool, not just numbers on a dashboard.
Conclusion
Magento 2 web analytics is not about the number of reports, but the quality of answers to your business questions. What was the user looking for on the page? Why did they not complete the purchase? How does behavior change after a redesign? To get these insights, you need more than a single tool; you need a full toolkit.
Think in terms of a stack: traffic analytics (GA4), event-based product analytics (Mixpanel/Amplitude), and in-page behavioral analysis (Hotjar/Clarity). Together, they provide the most complete picture, from where a visitor came from to why they did not buy.
Start collecting data from day one, even if you are not yet sure how you will use it. This will let you make informed decisions when they matter most.
Head of Product at Mirasvit
Magento 2 Reports Extension gives you 20 ready-to-use reports, a custom report builder, and multiple dashboards - everything Magento's default reports leave out.
Install Magento 2 Advanced Reports and take your online store's analytics to the next level!
Get in-depth reports on your customers' behavior while they are shopping using our Google Analytics 4 with GTM extension.
Utilize this module to integrate eCommerce Tracking with Google Analytics 4 and identify bottlenecks in the shopping process within your store.
Keep Learning